

The EUR/USD made a bullish bounce at the 144 ema close. The uptrend is now aiming at the Fibonacci targets after price action broke above the resistance.
This article reviews the main targets for the bulls. We also analyze the potential bearish reversal zones.
Price Charts and Technical Analysis

The EUR/USD is making a bullish break as expected. The swing-up is probably a wave C (grey) of a larger ABC pattern (grey).
The main targets are therefore the -27.2% and-61.8% Fibonacci levels. Also, the 78.6% and 88.6% Fibonacci retracement levels are key.
- A bearish reversal could take place in this resistance zone.
- The bounce (orange arrows) would confirm the end of the ABC (grey) in wave B (pink).
- A bearish wave C could take place in the larger wave 4 (purple).
- Later on, even a wave D and E could develop as part of a triangle pattern.
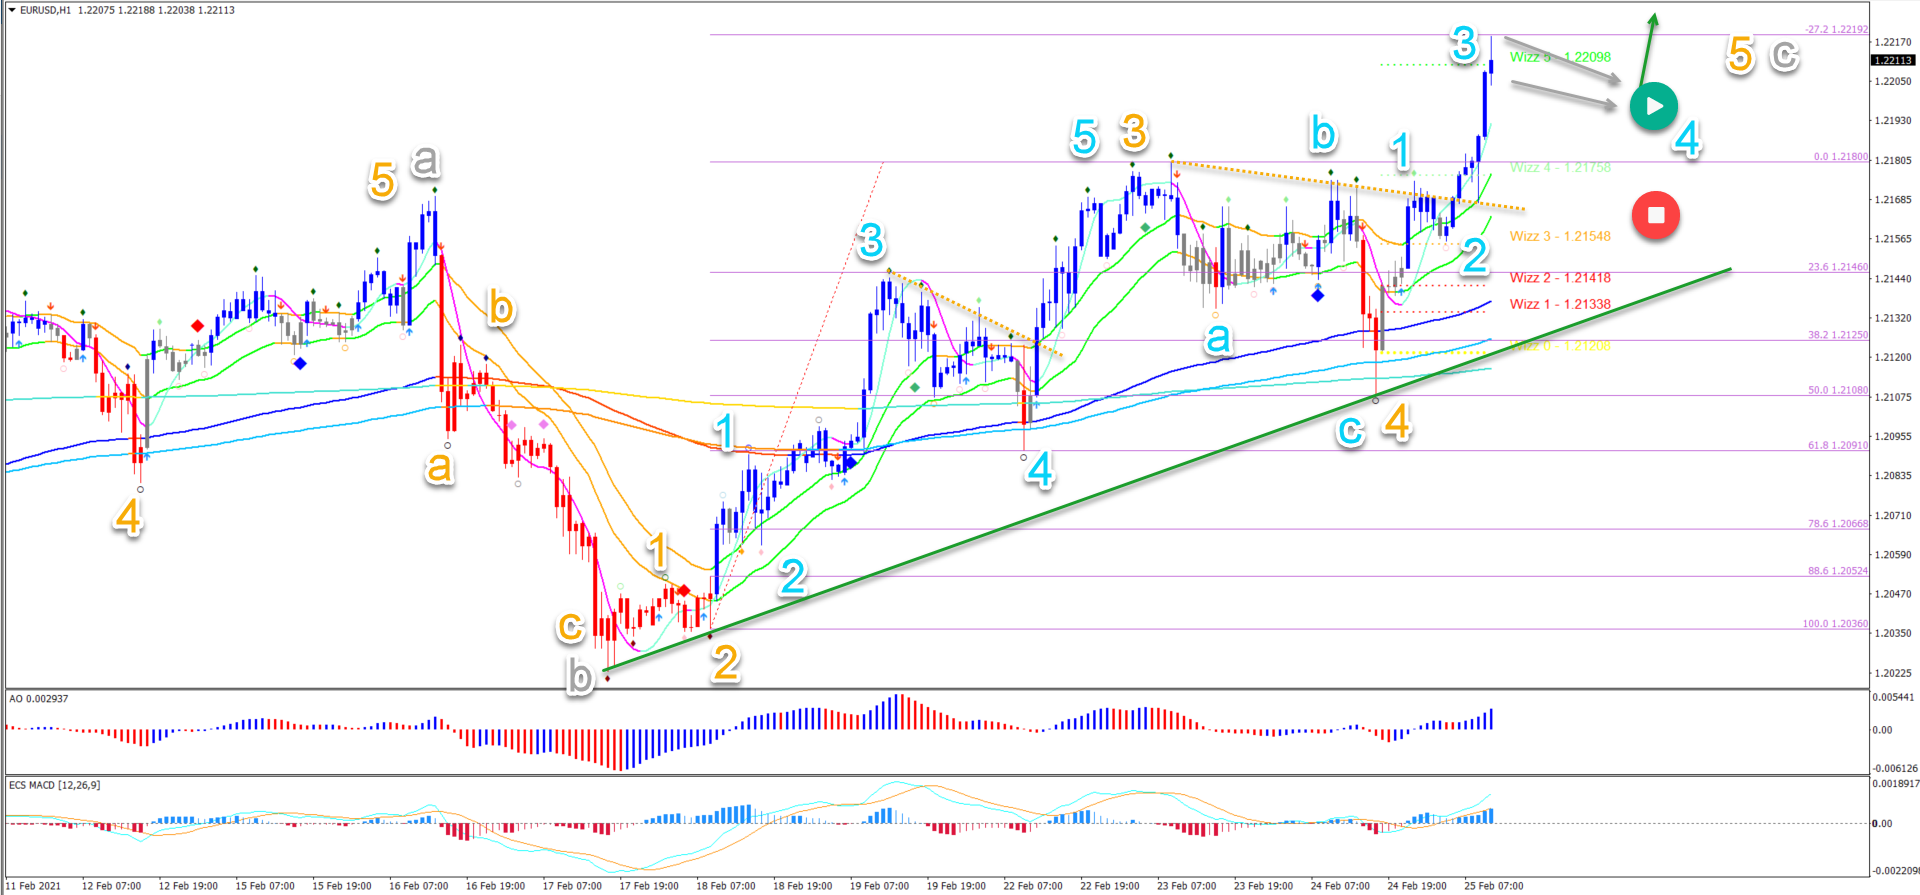
On the 1 hour chart, price action completed a bearish ABC pattern(light blue) in wave 4 (orange).
The bullish swing is showing strong momentum. This is probably a wave 3 (light blue).
A bull flag chart pattern (grey arrows) would confirm the expected wave 4 (light blue) pattern. But price action must not break below the top of wave 1 otherwise the wave analysis becomes invalid (red circle).



Comments
Log in or sign up to join the conversation.