
EUR/USD
4 hour
(Click on image to enlarge)
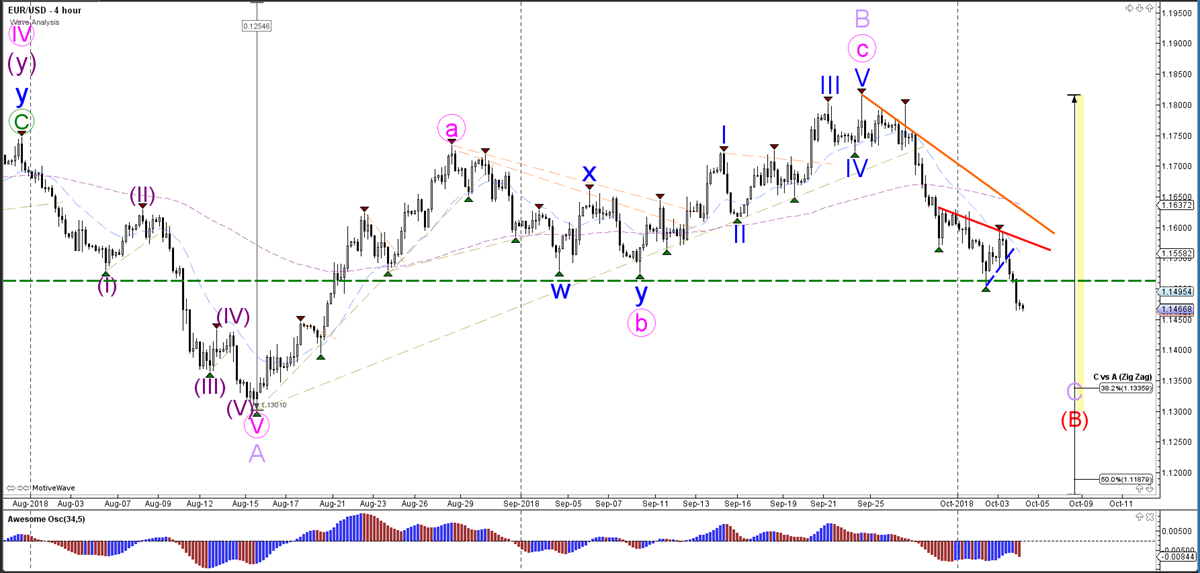
Source: Admiral Markets MT5 with MT5SE Add-on EUR/USD motive wave – Accessed 4 October 2018 at 5:00 AM GMT
The EURUSD currency pair made a bearish break below the major support trend line (dotted green) and the round level of 1.15. The bearish breakout and candlestick patterns could indicate a change of trend and make a bearish continuation more likely. This makes it likely that a potential wave B (purple) has been completed, and that the price is starting a bearish wave C (purple).
1 hour
(Click on image to enlarge)
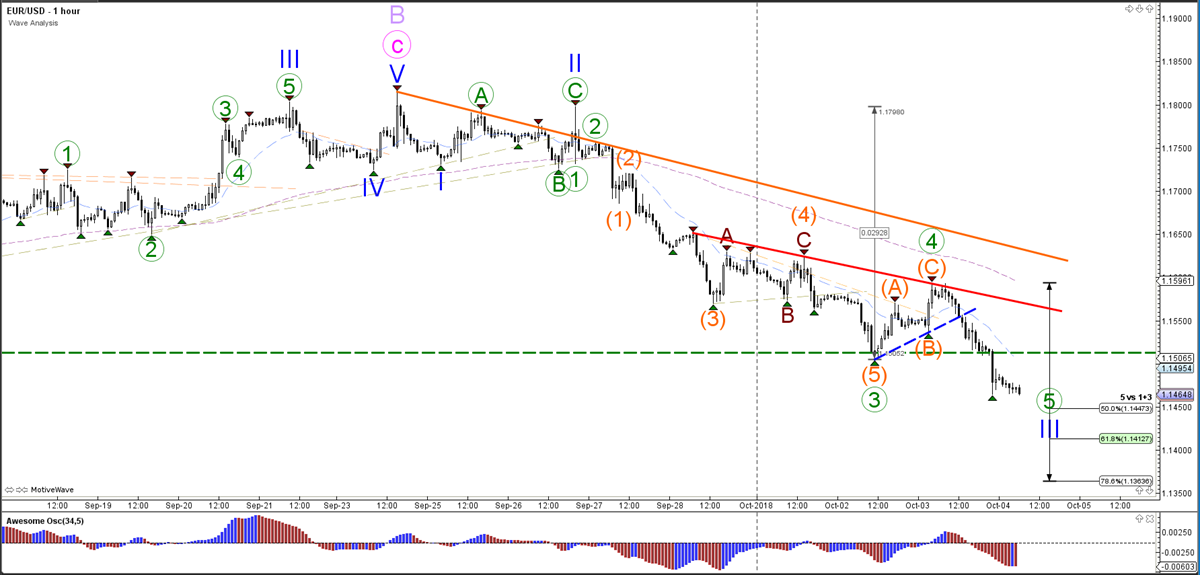
Source: Admiral Markets MT5 with MT5SE Add-on EUR /USD motive wave – accessed 4 October 2018 at 5:00 AM GMT
The EUR/USD currency pair broke below the support trend lines (dotted) after completing an ABC (orange) correction. The price is now falling towards the Fibonacci targets of wave 5 vs 1+3.
Daily
(Click on image to enlarge)
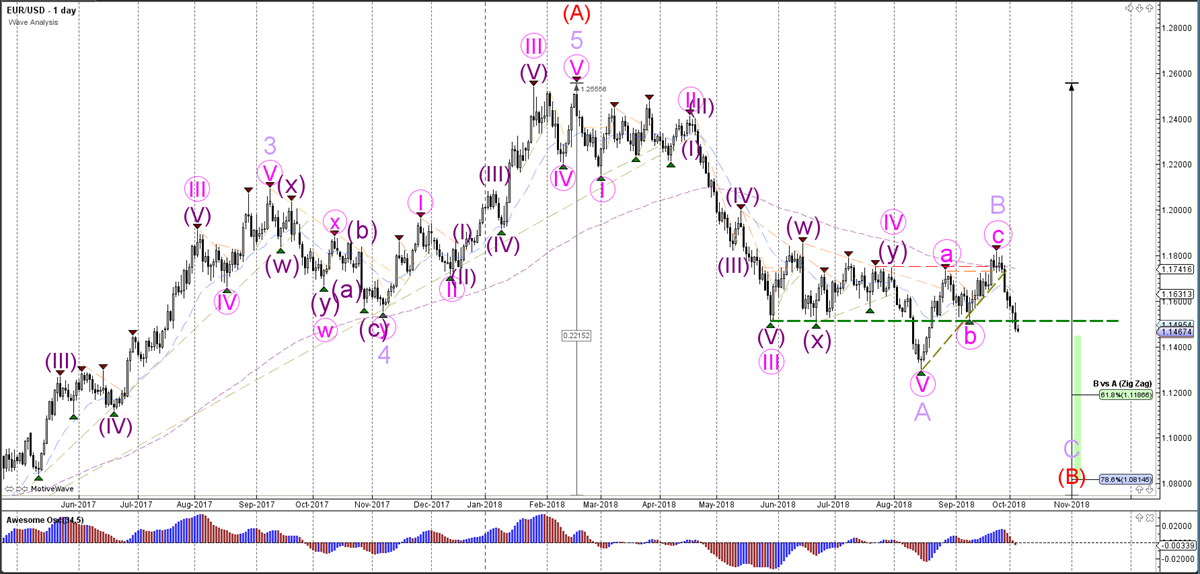
Source: Admiral Markets MT5 with MT5SE Add-on EUR /USD motive wave – accessed 4 October 2018 at 5:00 AM GMT
The EUR/USD currency pair bearish breakout is decreasing the chances of a potential larger WXY correction (pink) within wave B (purple), and making it more likely that the wave B (purple) has already been completed.


Comments
Log in or sign up to join the conversation.