


EURUSD has formed a well-defined ascending channel that’s been guiding price higher over the past few weeks, with the pair currently pulling back from the channel top near 1.1482 and testing support within the formation.
The Fibonacci retracement tool highlights where buyers could return to defend the climb. The 38.2% Fib lines up at 1.1441, close to where price is currently changing hands, while a deeper pullback could reach the 50% level at 1.1429.
A larger correction might test the 61.8% Fib at 1.1416, near the rising trend line that forms the bottom of the channel around the 1.1400 major psychological mark, which could be the line in the sand for a bullish pullback.
If any of these levels hold as a floor, EURUSD could resume its climb toward a retest of the channel top near 1.1482 or higher. A break below the Fibs and the channel’s lower boundary, on the other hand, could set off a deeper drop toward the 100% Fib at 1.1375 or lower.
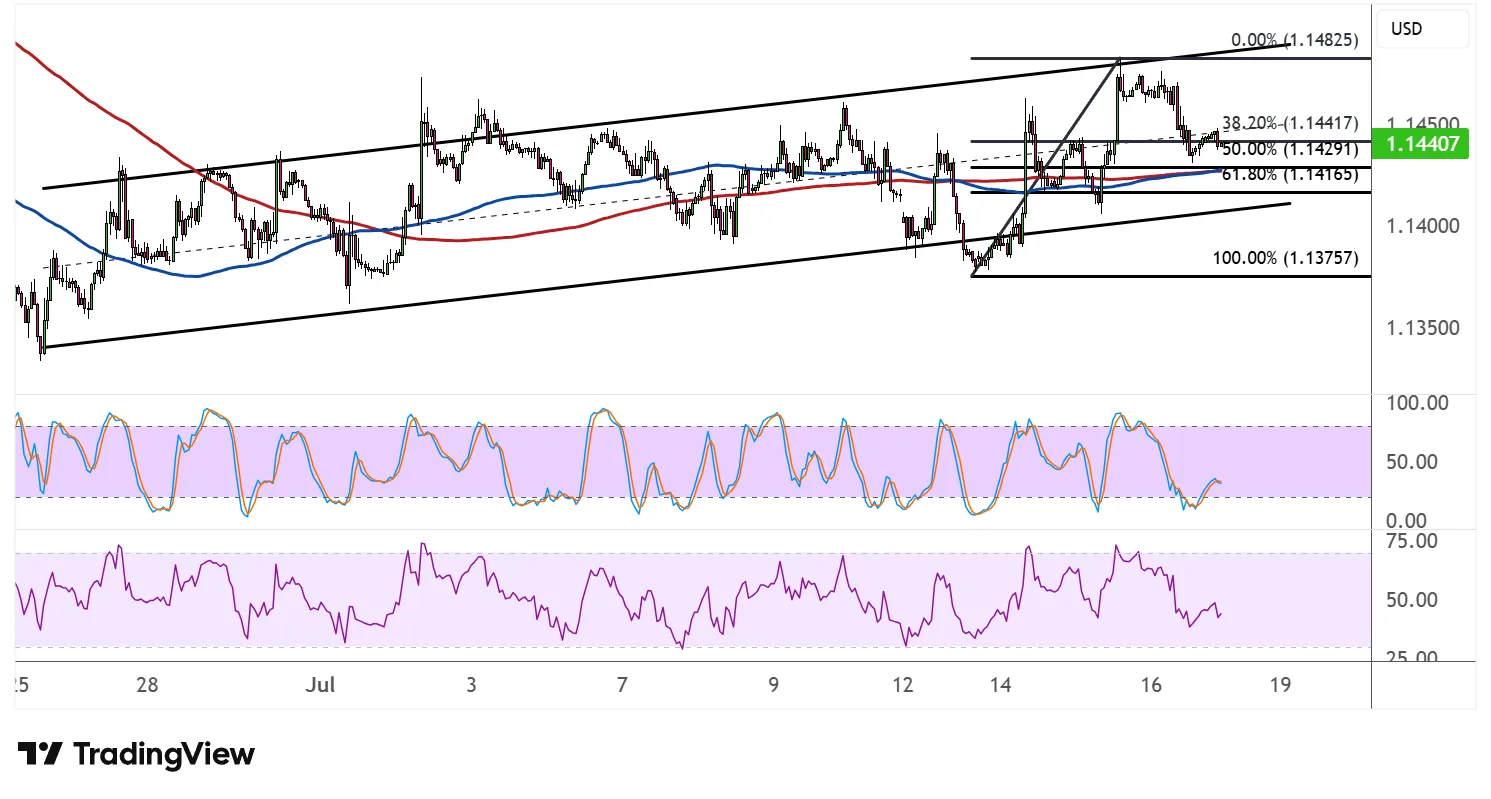
The 100 SMA is above the 200 SMA to confirm that the path of least resistance remains to the upside, or that the climb is more likely to gain traction than reverse. Price is hovering near both moving averages, which could offer additional dynamic support on this dip.
Stochastic has fallen from overbought territory and is approaching the oversold zone, reflecting fading bullish momentum for now. Still, the oscillator has room to slide further before reaching oversold levels, so the correction could continue a bit longer before buyers step back in.
RSI, meanwhile, is easing back from the upper half of its range and has room to fall before reaching oversold territory, suggesting price could keep drifting lower while sellers have a slight edge in the near-term, before the broader uptrend potentially resumes.
EURUSD could take cues from USD direction, which appears to be driven by softer data contrasting with a hawkish Fed outlook, as well as safe-haven flows.



Comments
Log in or sign up to join the conversation.