

Yesterday’s Summary
Yesterday I have talked about the space that was shrinking and the price could break out somewhere.
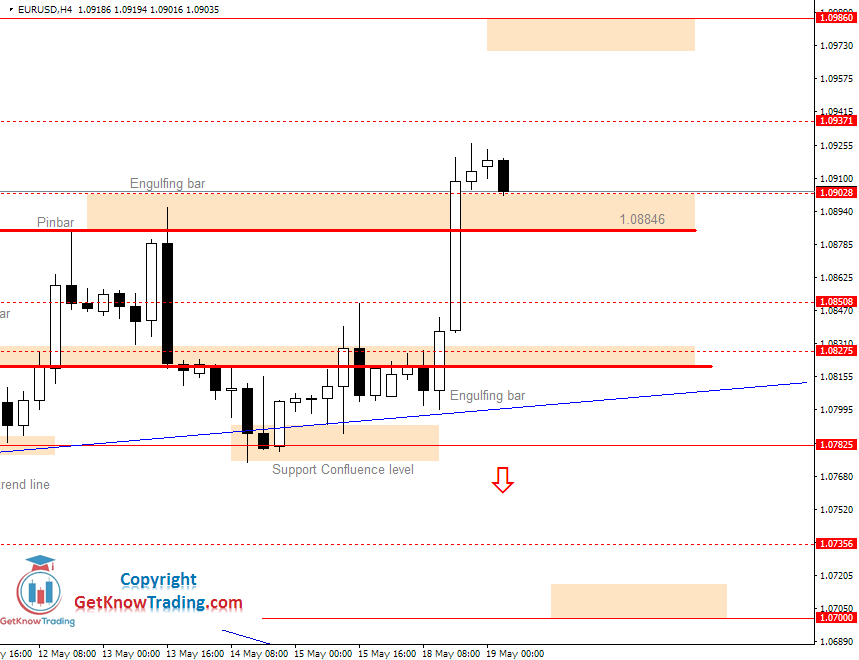
And, break out pushed the price strongly above the range area. Price needed only two candles to drive the price above range area and close above resistance level 1.09028.
First sign that the bulls could make a move was an engulfing candle that engulfed the previous four H4 candles. That was a sign the bulls are stronger and they will take the lead.
Second candle was during London and New York trading session overlap. Candle is over 70 pips large which was a sign that the Europe and U.S. traders think that the price should move up.
Strong buying power pushed the price above range area and closed above resistance line.
Today’s EURUSD Chart Forecast
Today we could see price moving a little back down making pullback before moving further up. To validate that direction we should wait for the bullish price action signal in the upper side of the range area.
That is the area between 1.08846 and 1.09028.
EURUSD Chart – Bullish Scenario
If we see bullish signal we could enter into the trade and wait price moving up to the first resistance level, at 1.09371.
Price could move a little bit more up from that resistance line, up to 1.09550. That was the high of the previous H4 candles when the price was moving up in the last break out from the range area.
EURUSD Chart – Bearish Scenario
While the status has changed from a very possible bearish situation to very unlikely we can see that we cannot rule out both possible scenarios.
If the price manages to break down through range area and close below 1.07825 level we could see price moving more down.
To make that happen we have seen that we need only one strong candle to push the price through range area.


Comments
Log in or sign up to join the conversation.