

The EUR/NZD has made a bullish bounce at the -27.2% Fibonacci target. Is this pair ready for a larger reversal after its 3,500 pip decline?
Price Charts and Technical Analysis
(Click on image to enlarge)
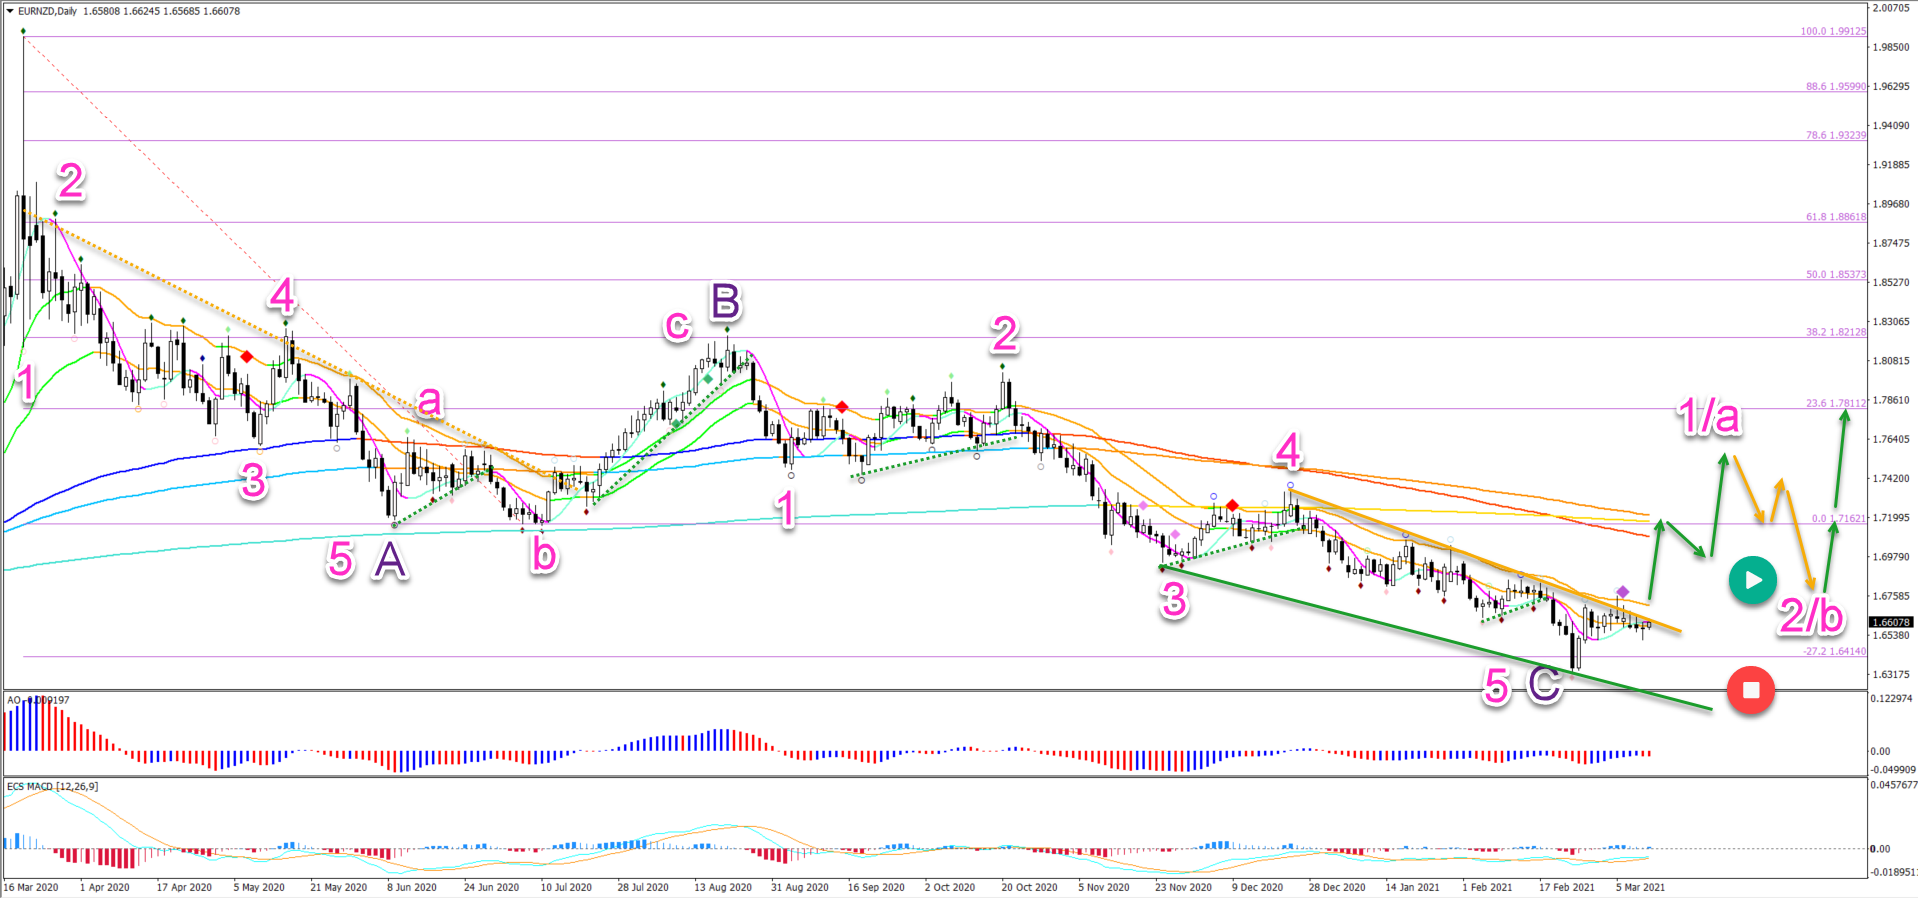
The EUR/NZD downtrend is not officially over yet. But there is a fair chance that a bearish ABC (purple) pattern has been completed at the most recent low.
- A bullish breakout above the 21 ema zone and the resistance trend line (orange) confirms the bullish reversal (green arrow).
- The first target is the 144 and 233 ema zone.
- A bull flag pattern in this ema zone could indicate more upside.
- A strong push up could confirm a wave 1 or A (pink).
- A bearish break, however, below the -27.2% Fib target invalidates (red circle) the bullish reversal and indicates a continuation of the downtrend.
On the 4 hour chart, the bullish price swing seems to be a 5 wave pattern up (grey). This is probably a bullish wave 1 (grey – or a wave A).
- The current pullback is choppy and corrective and could be a wave 2 (orange).
- The wave 2 outlook remains valid as long as price action remains above the bottom and 100% Fib. A break below it invalidates it (red circle).
- A deeper bearish pullback (red dotted arrows) is expected to test the Fibonacci retracement levels and bounce (blue arrows).
- An immediate bullish breakout (green arrows) could indicate the end of wave 2 (orange) and the start of a wave 3 (orange).
- A bull flag pattern (grey arrows) could indicate more upside after the break (green arrow).
(Click on image to enlarge)




Comments
Log in or sign up to join the conversation.