

The EUR/GBP has made a key bullish bounce at the 61.8% Fibonacci retracement. This occurred after price action made a breakout above the key resistance trend line (dotted red).
This article will examine whether a long-term bullish reversal can indeed take place on the daily chart.
Price Charts and Technical Analysis
(Click on image to enlarge)
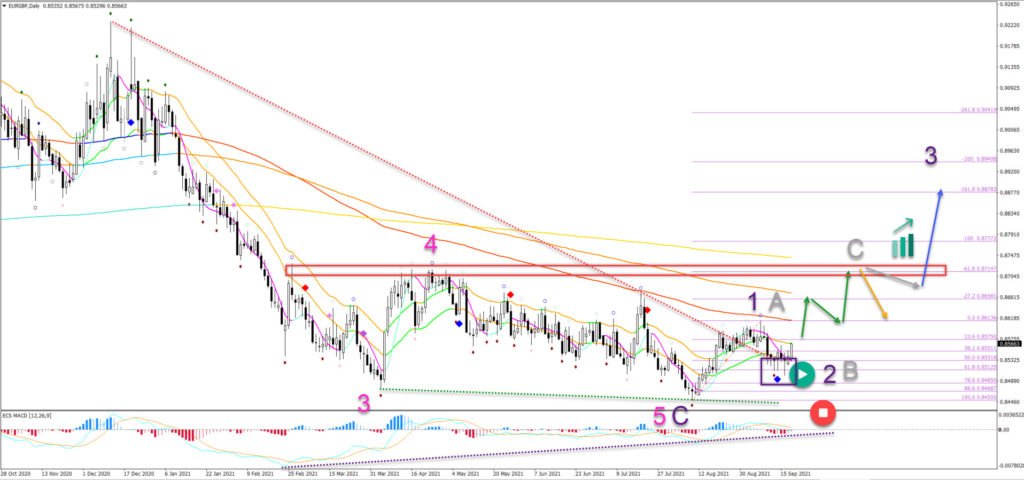
The EUR/GBP daily chart is showing wicks on the bottom of the daily candle. Price action is now testing the 21 ema resistance zone:
- A push above the 21 ema zone could indicate a bullish breakout (green arrow).
- The first target is the -27.2% Fibonacci level at 0.8658.
- A bull flag or pullback after hitting the first target could see price action move up again towards the second target at the -61.8% Fibonacci level at 0.8715.
- A break (blue arrow) above the resistance zone (red box) could indicate a larger bullish reversal via a wave 3 (purple) pattern.
- A bearish bounce (orange arrow) leaves the window open for an ABC (grey) pattern.
On the 4 hour chart, the EUR/GBP is showing a bullish breakout above the resistance trend lines (red dotted):
- Price action seems to have completed a 5 wave pattern (pink) in wave 1 (purple).
- A bearish ABC (pink) could have completed wave 2 (pink).
- A bearish breakout (red arrows), however, below the support trend line (green) could indicate a deeper wave 2 at the 78.6% Fibonacci level.
- A break below the bottom invalidates (red circle) the wave 1-2 (purple) pattern.
- A bullish continuation (green arrow) above the current candle indicates an immediate push higher. A small pullback (orange arrow) also could see a push up (green arrow).
- A bull flag pattern (grey arrow) could kick start a larger bullish breakout (blue arrow).
(Click on image to enlarge)




Comments
Log in or sign up to join the conversation.