
Today we will talk about the EURCAD currency pair, its price action from technical point of view, and wave structure from the Elliott Wave perspective.
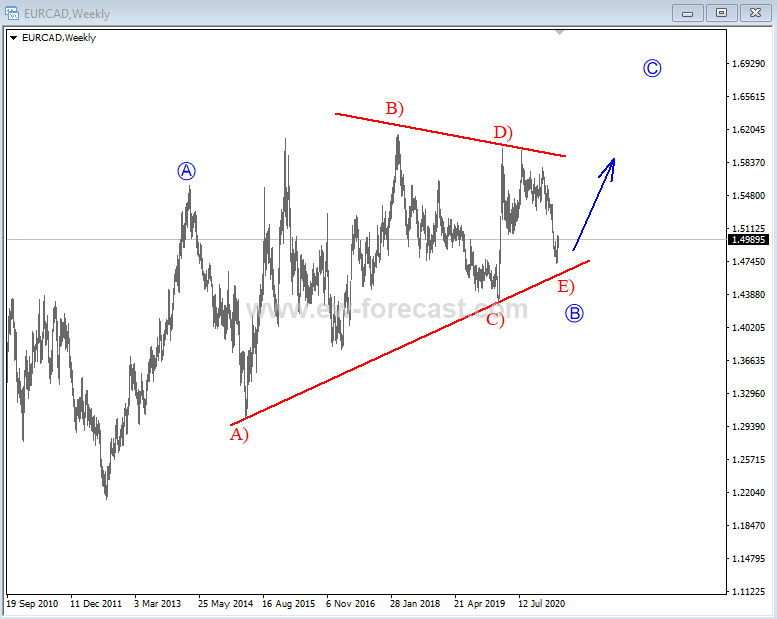
If we take a look at the weekly chart we can see big sideways price action and wave structure which looks to be a big bullish running triangle pattern in wave B. Triangles consist of five waves A)-B)-C)-D)-E) that can be approaching the end as we see it at key lower triangle line support area for the final wave E). If that's the case, then a higher degree wave C back to highs might come in play in upcoming weeks/months.
EURCAD, Weekly
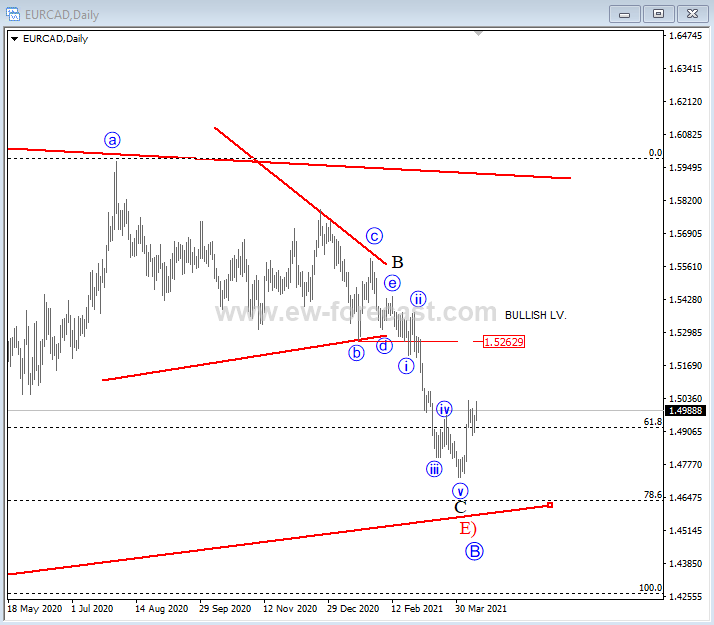
If we take a look at the lower time frame, on a daily chart, we can actually see a three-wave A-B-C corrective decline in that final wave E) of B, where wave C has a clearly completed five-wave cycle, which can be an indication for a completed corrective decline. However, as you can see, bulls could be confirmed only if we see a recovery back above 1.5262 region.
EURCAD, Daily
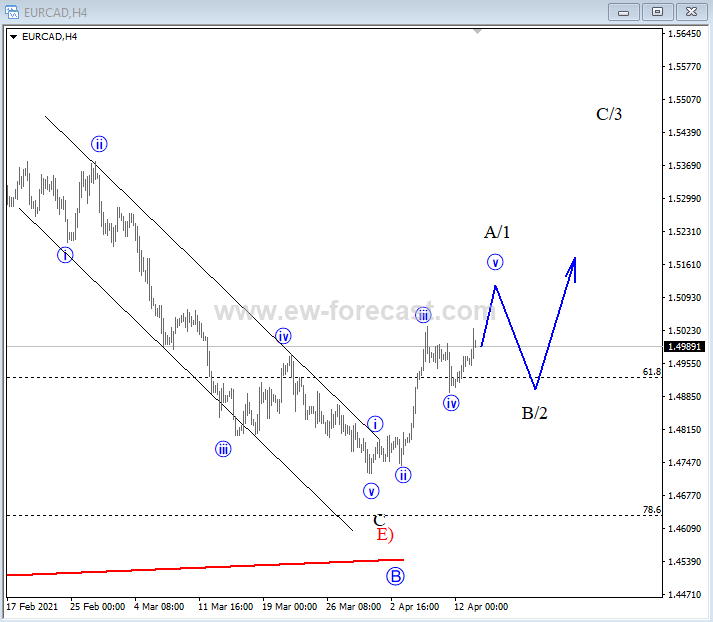
Let's take a closer look. Looking at the 4-hour chart, we can potentially already see it unfolding five waves up from the lows into the first higher degree A/1 leg, which actually indicates for the bottom and bullish reversal that can send the price higher within wave C/3, but before a continuation higher, be aware of a temporary corrective pullback in wave B/2.
EURCAD, 4h


Comments
Log in or sign up to join the conversation.