

EURAUD has been carving out a series of lower highs connected by a descending trend line since late July, while horizontal support around 1.6270 has held firm on multiple occasions, forming a descending triangle pattern on the chart.
Price is now testing this support floor once again, and how it reacts here could determine the pair’s next major move. A bounce off the 1.6270 area could spark a rally back up to the descending trend line resistance near 1.6400, especially if bulls manage to reclaim the moving averages along the way.
A break and daily close below the triangle support, on the other hand, could confirm a bearish breakdown and set off a measured move selloff roughly equal to the height of the triangle’s widest point. That could drag EURAUD down to the 1.6100 handle or lower in the sessions that follow.
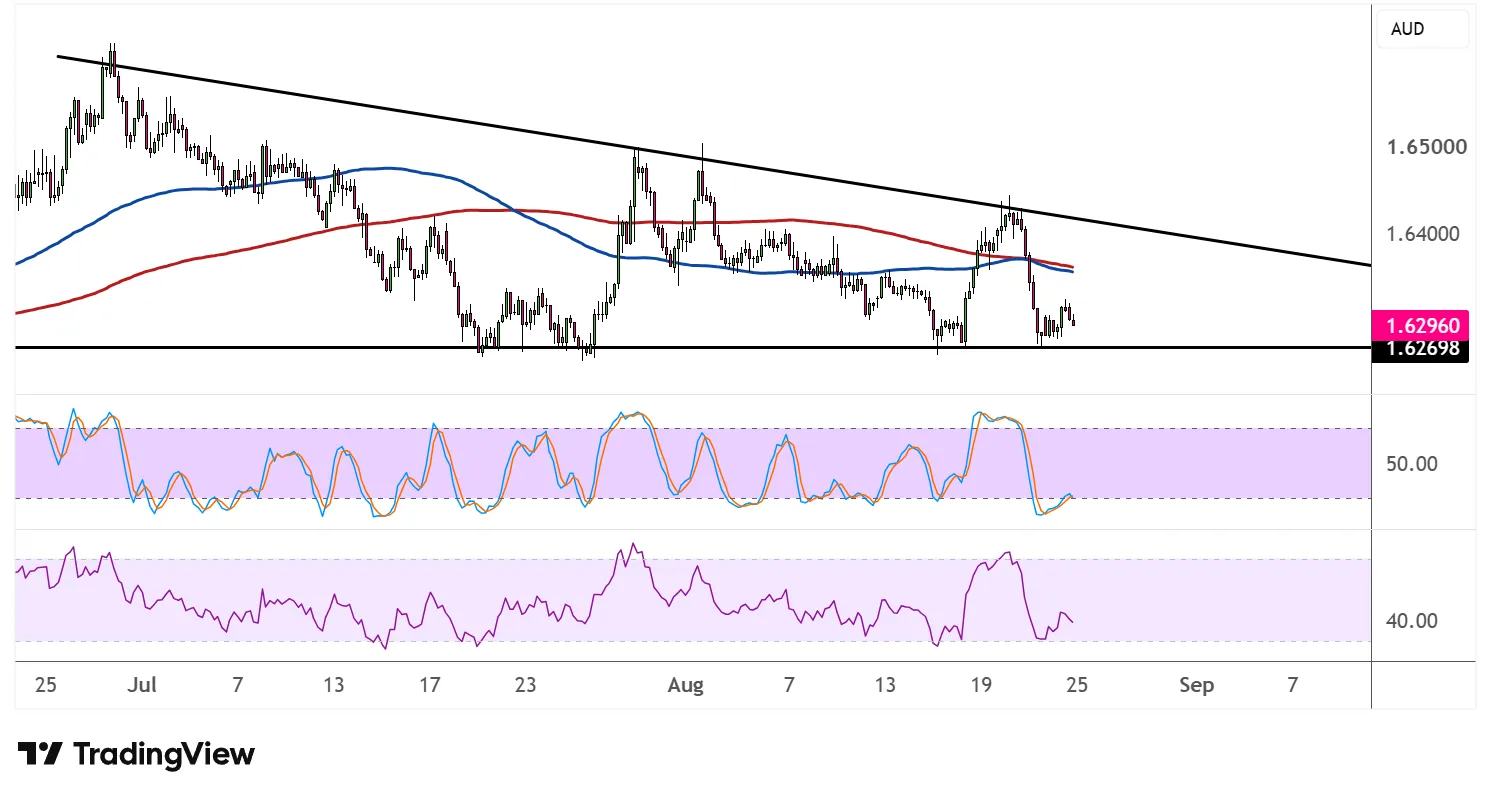
The 100 SMA is below the 200 SMA to confirm that the path of least resistance is to the downside or that any recovery attempts are more likely to fade than to hold. Price is also stuck below both moving averages, which could continue to serve as dynamic resistance on bounces.
Stochastic is hovering near the oversold region, reflecting exhaustion among sellers after the latest leg down. The oscillator could be due for a turn higher, which might translate to a corrective bounce before the broader trend resumes.
RSI, meanwhile, is hovering below the 40.00 mark, still with some room to fall before reaching oversold territory. This leaves the door open for sellers to keep pressing their advantage unless a stronger reversal signal emerges.
With the pair sitting right at the apex of the triangle, a decisive break in either direction could set the tone for EURAUD’s next sustained trend. The pair could take cues from Australia’s upcoming CPI release which could strongly influence September tightening hopes.



Comments
Log in or sign up to join the conversation.