


Ethereum tops $2,340, just above a closely watched support zone at $2,310.
U.S. spot Ethereum ETFs have recorded $1.26 billion in October outflows.
ETH faces initial resistance at $2,444, while a breakdown could expose support at $2,256.
Ethereum has surged past $2,340 on Wednesday, consolidating after last week’s decline as buyers defended an area where several important indicators converge.
ETH’s realized price stands at $2,310, its 200-day Exponential Moving Average sits near $2,315, and wallets holding between 1,000 and 10,000 ETH have an average cost basis of $2,328.
Those measures fall within an $18 range, making the area particularly relevant to the near-term outlook. Holding above it would preserve a potential base for recovery, while a sustained breakdown would weaken that support structure.
Ethereum’s ETF redemptions make the $2,310 zone a key decision point.
51% of retail investor accounts lose money when trading CFDs with this provider.
Onchain cost basis provides a test for buyers
CryptoQuant places Ethereum’s realized price—an estimate of the market’s average onchain acquisition cost—at $2,310.
The level has historically provided support during downturns, and ETH has rebounded near it several times over the past three days.
A sustained decline beneath realized price could increase pressure on holders as the market moves below its aggregate onchain cost basis.
However, the indicator does not guarantee either buying support or accelerated selling.
Nearby, the $2,328 average cost basis of wallets holding 1,000–10,000 ETH adds another reference point.
This cohort increased its holdings by 40,000 ETH over the past week, while larger holders remained broadly steady, according to the CryptoQuant data.
The accumulation offers a supportive signal despite continued weakness elsewhere in the market.
US spot Ethereum ETFs recorded $88.5 million in net withdrawals on Monday, followed by another $60.22 million on Tuesday.
The withdrawals follow $220.6 million in outflows during October 19–23, according to SoSoValue.
October’s cumulative withdrawals reached $1.26 billion through Monday. That makes it the second-largest monthly outflow since the products launched, behind November 2025’s $1.42 billion.
Approximately $160 million in additional net withdrawals would bring October level with that record; a larger amount would surpass it.
Bitcoin ETFs have experienced considerably smaller net withdrawals this month. They recorded $110.3 million in inflows on Monday, leaving October’s net outflows at approximately $202 million.
In dollar terms, Ethereum ETF withdrawals were therefore roughly six times Bitcoin’s monthly total, highlighting the heavier redemption pressure on ETH-linked products.
Ethereum technical forecast: ETH faces resistance above $2,440
Ethereum has surged past its 200-day EMA near $2,315 after holding that level earlier this week.
However, a daily close below the average would weaken the technical picture and bring support at $2,256 into focus. Further downside levels sit at $2,204 and $1,971.
For buyers, the first recovery obstacle is the 100-day EMA at $2,362. A decisive daily candle close above this level could see ETH face resistance at $2,444, followed by the 50-day EMA at $2,453.
A daily close above that broader resistance cluster would help ease the bearish tone and could open a path toward $2,548 and $2,636.
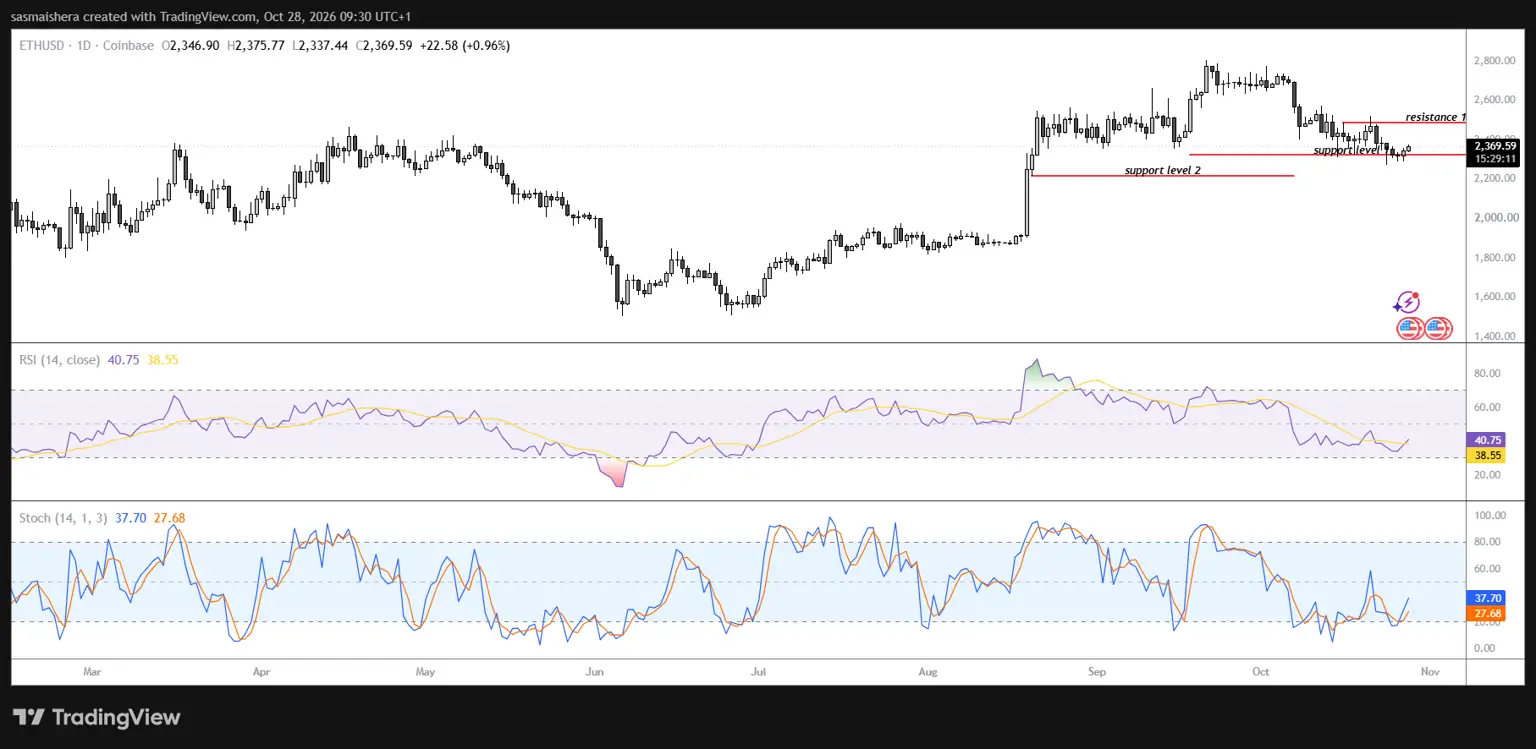
The 14-day Relative Strength Index stands at 38, close to the conventional oversold threshold, while the Stochastic Oscillator reads 27.
These readings suggest downside momentum may be stretched, but they do not establish that a reversal has begun.
CoinGlass data also showed $40 million in ETH futures liquidations over the preceding 24 hours, including $34 million in short positions.
For now, defending the $2,310–$2,328 zone and reclaiming nearby resistance remain the key technical tests as ETF redemptions continue.



Comments
Log in or sign up to join the conversation.