

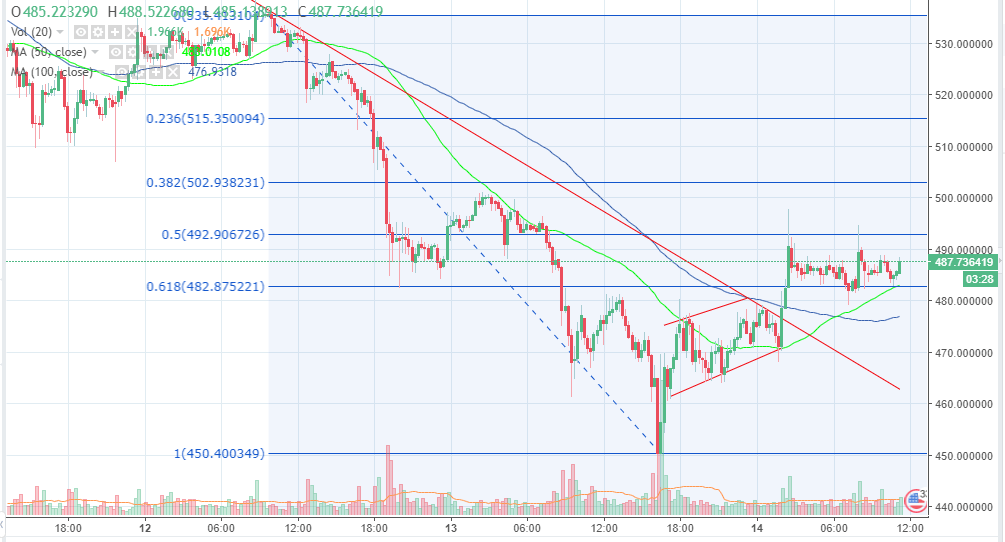
Like most cryptocurrencies, the Ethereum price continues to correct upwards on Thursday. The Ethereum dropped below the $ 470 support in yesterday's session and reached the $ 450 area before turning. He formed a short bullish flag pattern toward the end of the session, but broke back upward during today's Asian session. However, the rise has been limited around $ 490 and attempts to break above this level have been limited by selling pressure.
The ETH / USD has formed another short-term bullish pattern, a pattern that could be overcome by breaking the $ 490 level and approaching the key resistance zone by $ 500. However, at this level bulls will have to fight resistance to 50% of the Fibonacci retracement level. A weak upward momentum is forming on the chart, in addition to the stochastic is at 32% and sends bullish signals in the short term.
On the other hand, the 50-period moving average in the 15-minute chart is above the 100 SMA and supports the price at the $ 483 level. At this level, 61.8% of the Fibonacci retracement also converges. Below, the 100-period moving average will support the falls at the $ 480 level, before the $ 470 support.
ETH / USD 15 minute chart
Comments
Log in or sign up to join the conversation.