

(Click on image to enlarge)
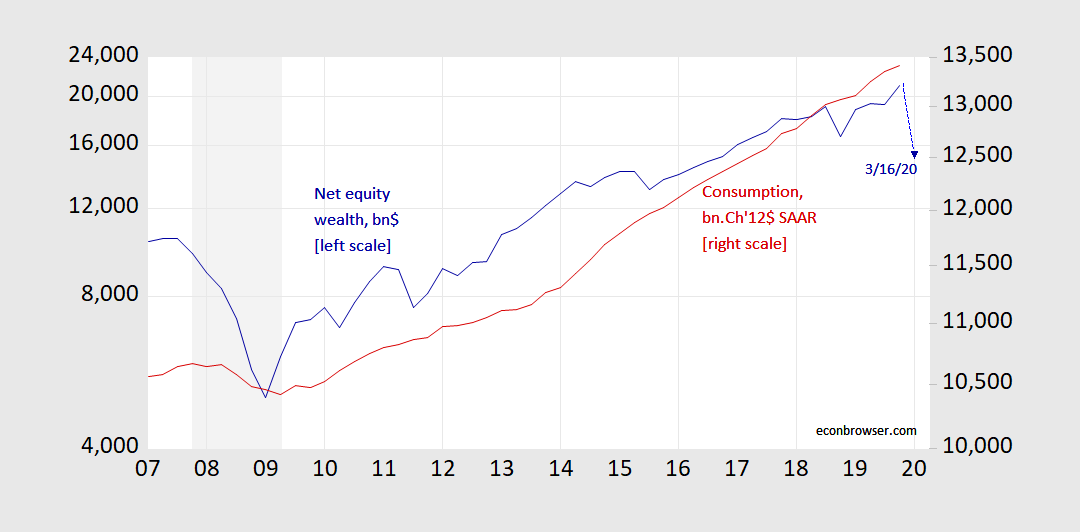
Figure 1: Household equity wealth, in billions dollars (blue, left log scale), and estimated based on Russell 5000 (blue triangle at 2020Q1), and consumption, in billions Ch.2012$ SAAR (red, right log scale). Source: Fed Flow of Funds, via FRED, BEA 2019Q4 2nd release, and author’s calculations.
Note that scales are in logs. The picture looks a lot worse in levels.
On the other hand, equities net worth is only about 18% of total net worth in 2019Q4.


Comments
Log in or sign up to join the conversation.