


The FOMC has the green signal from both jobs and inflation to tighten policy this week. The major equity indices on Friday – the day August’s CPI was published – behaved as if all this was priced in, which we will find out for sure this week.
Ahead of this week’s Tuesday-Wednesday FOMC meeting, the topic of inflation is front and center.
The Federal Reserve operates on a dual mandate – maximum employment and price stability. The unemployment rate in August came in at 4.1 percent and has not had a five handle in five years; the month also produced 162,000 non-farm jobs, which were much better than expected, even as both June and July were revised higher.
Concurrently, consumer inflation, measured by both the consumer price index (CPI) and the personal consumption expenditures (PCE), has come in north of the central bank’s stated goal of two percent for over five years now. Headline and core CPI for August was reported last Friday, and they respectively grew 3.40 percent and 2.45 percent. Futures traders are now betting with 87 percent probabilities that the FOMC would end up hiking the fed funds rate by a quarter point this week.
Even as inflation persisted well north of two percent, the fed funds rate has been left unchanged since last December when it was reduced by 25 basis points; this preceded a cut of similar magnitude in September and October. Earlier, rates reached a cycle high 5.25 percent to 5.50 percent in July 2023, followed by cumulative cuts of 100 basis points over three meetings in 2024. Earlier, the Fed tightened rapidly through 2022 and 2023.
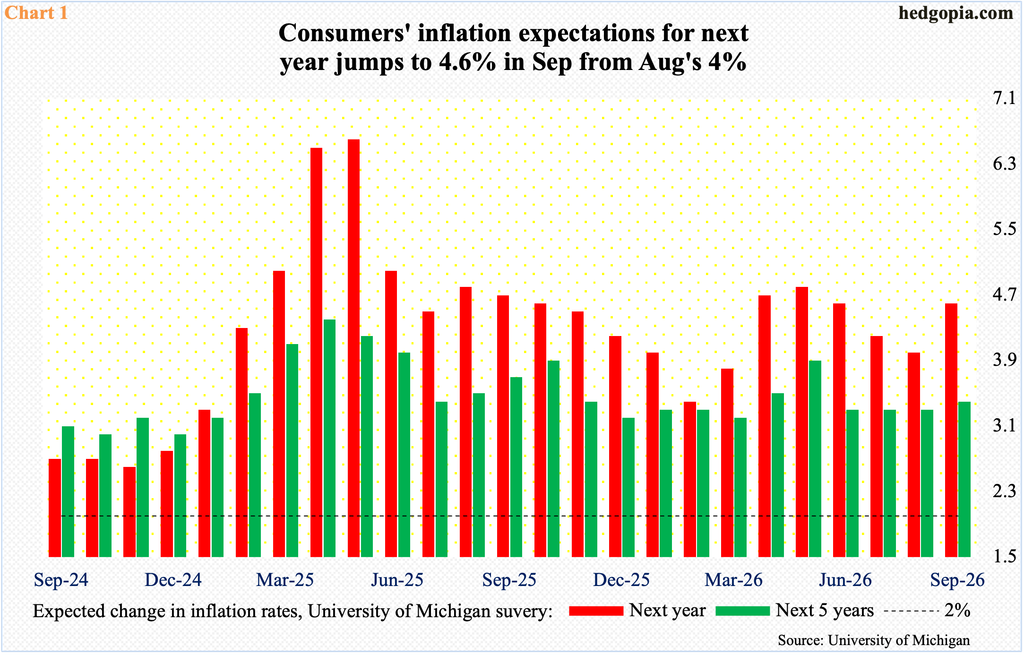
Consumers do not expect a reprieve in price pressures anytime soon. Also last Friday, the University of Michigan’s preliminary count for September showed consumers’ inflation expectations for next year jumped to 4.6 percent from August’s four percent (Chart 1). The public absolutely does not trust the Fed’s two percent goal. The closest these expectations came was 2.1 percent in April 2020.
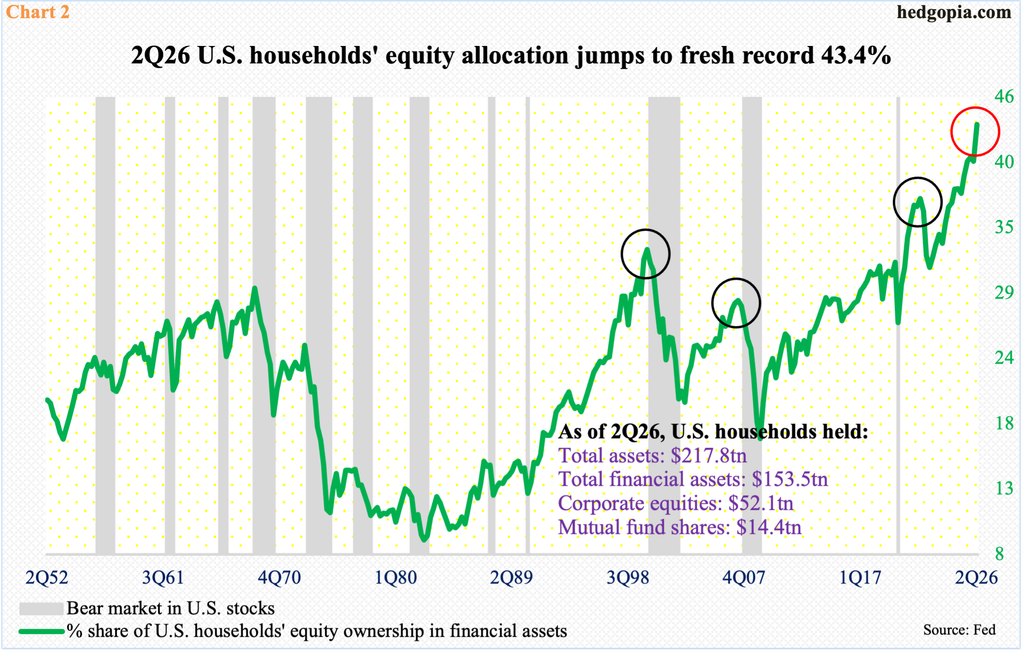
Consumers are feeling the pinch in shopping, but arguably this is being neutralized at least in part by inflation somewhere else – their investment portfolio.
In the June quarter, households’ equity allocation jumped to 43.4 percent – a fresh record and much, much higher than prior peaks. The allocation peaked at 32.9 percent in 1Q00 (dot-com bubble), 28.7 percent in 2Q07 (great financial crisis) and 37.2 percent in 4Q21 (tighter monetary policy). This time around, the green line in Chart 2 has gone parabolic since bottoming at 31.4 percent in 3Q22.
The allocation probably has gone even higher in the current quarter. With 13 trading sessions to go this month, the S&P 500 is up 2.1 percent quarter-to-date and was up as much as 4.2 percent through the August peak.
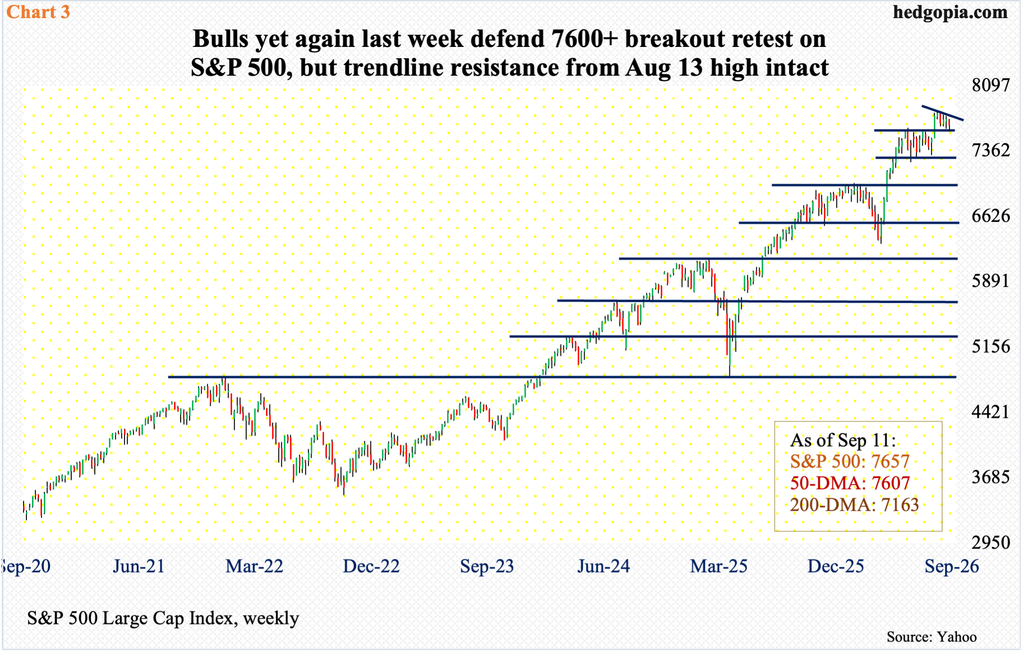
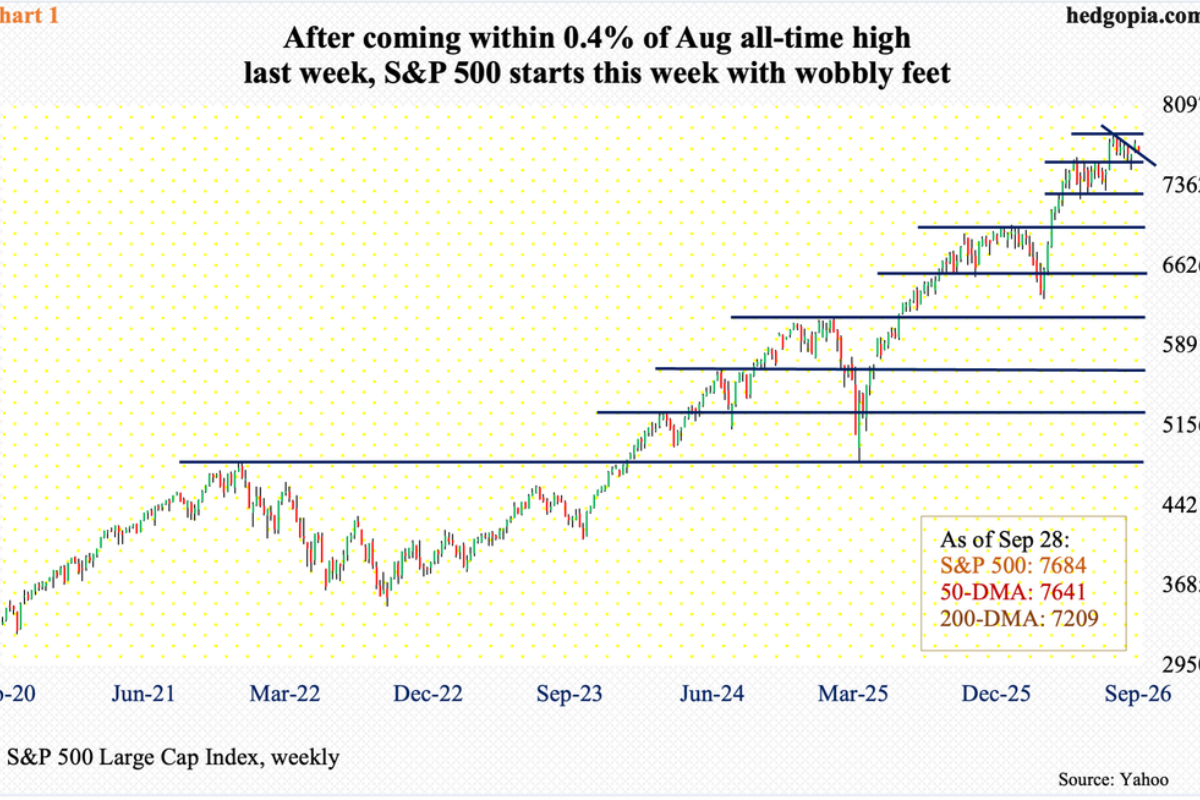
The S&P 500 tagged a fresh all-time high of 7817 on August 13 and headed lower. From the March 30 low 6317 through that high, the index was up 23.7 percent; from the April 2025 low 4835, the large cap index shot up 61.7 percent!
Since last month’s high, the S&P 500 has made lower highs. This is a win for the bears, but they cannot celebrate much until the index loses 7600-plus, which is proving to be a crucial level for both bulls and bears.
The S&P 500 earlier consolidated for a couple of months after peaking at 7621 on June 2. Bulls have failed to put an end to a pattern of lower highs but have done a good job of defending the breakout retest at 7600-plus. In fact, this has now gone on for four weeks (Chart 3).
Last Thursday – a doji session – bears came close as the index closed at 7592, which also breached the 50-day moving average (7607), but they were unable to continue the momentum on Friday as the S&P 500 finished at 7657, down 0.8 percent for the week.
In the near term, should the bulls pick up where they left off Friday, their first – and crucial – hurdle lies at 7720s, which is where the trendline resistance from last month’s high lies. On the weekly, however, there is a ton of room for the index to continue lower so the overbought condition it is in gets unwound.
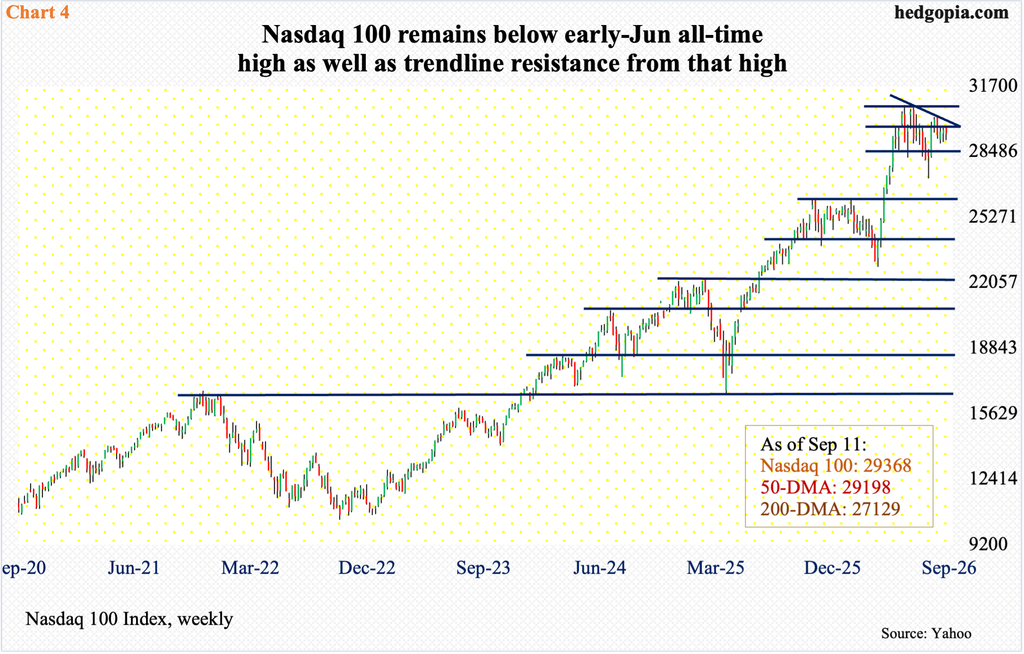
This also holds true for the Nasdaq 100, which has acted a lot more defensive of late versus peers like the S&P 500 and Russell 2000. The latter two rallied to fresh highs last month, while the Nasdaq 100 remains under the June 3 all-time high of 30762.
Last week, the tech-heavy index dropped 0.6 percent to 29368; through Thursday’s intraday low 29038, it was down 1.7 percent for the week, so tech bulls did put their foot down, but they have their work cut out in the sessions ahead.
A falling trendline from the June 3 high gets tested at 30000 (Chart 4). This is the potential upside for the bulls. Else, horizontal support at 28600s-28880s lies underneath, which, if tested, will have meant a breach of the 50-day (29198); then comes the 200-day at 27129.
Concurrently, the Russell 2000 acts as if the FOMC will end up raising the benchmark rates this week. Small-caps by nature have a large exposure to the domestic economy versus their mid- to large-cap cousins. They also tend to be leveraged, with more exposure to the short end of the curve. Higher rates do not help.
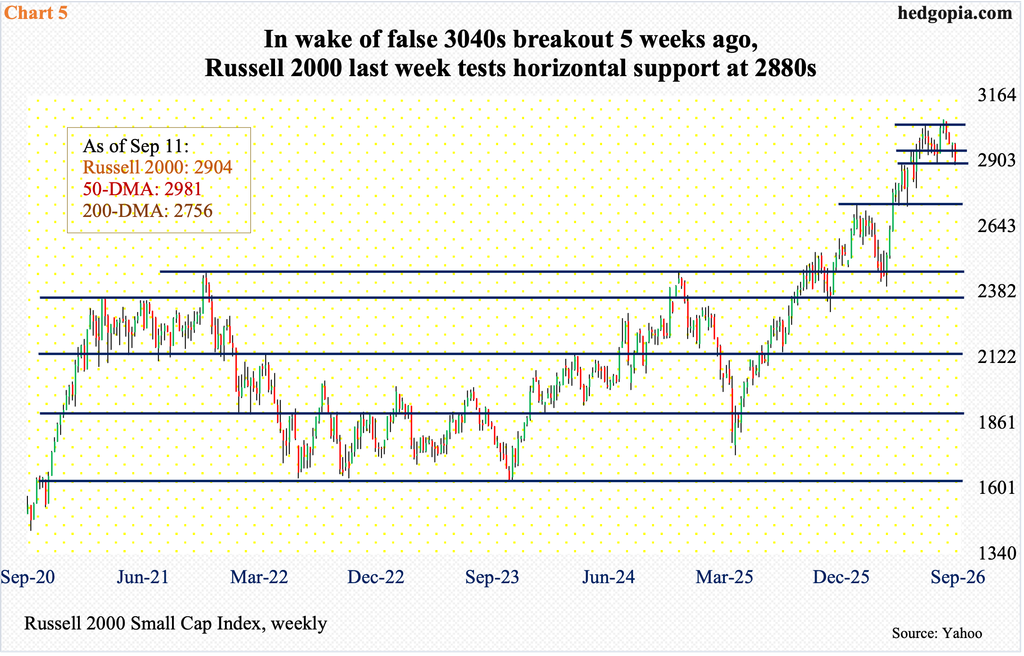
The Russell 2000 on August 14 reached an intraday high of 3070, breaking out of horizontal resistance at 3040s; the small cap index earlier hit 3047 on July 1, 3049 on August 5 and 3049 again on the 18th. The breakout, however, turned out to be false. The index has been on the defensive since that August 14 peak.
By Thursday last week, small-cap bears pushed the index down to 2887, testing horizontal support at 2880s (Chart 5). By Friday, the Russel 2000 closed the week at 2904, down 2.4 percent for the week. Bulls defended 2880s but have lost 2940s, which likely attracts selling pressure should the index manages to rally.
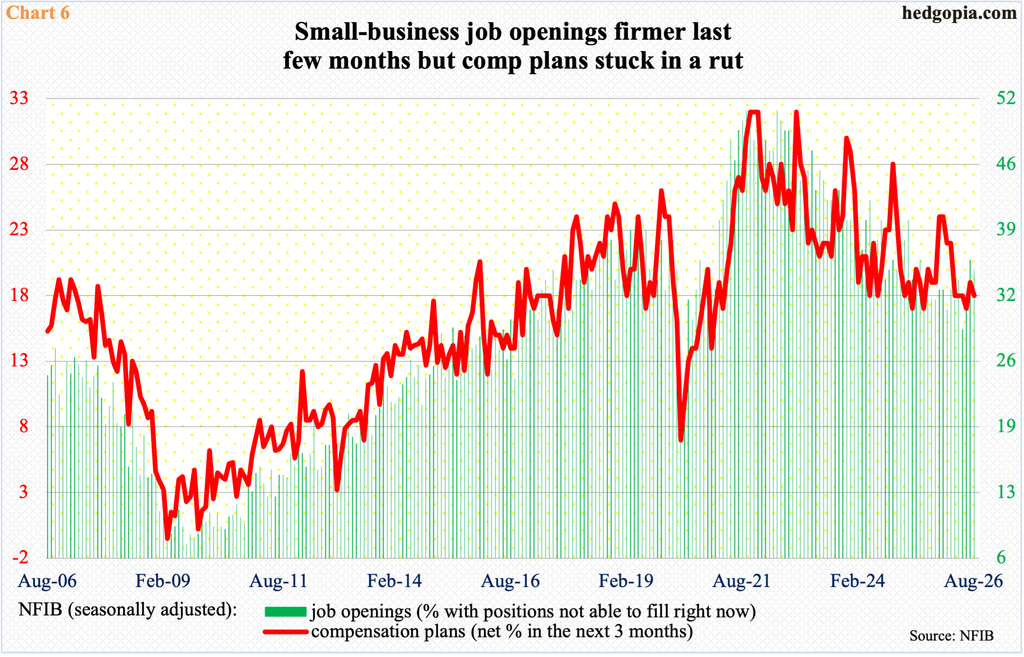
As the Russell 2000 acts tentative, there is an interesting dynamic going on within the NFIB small business optimism index. In August, the overall index declined 1.1 points month over month to 98.7; May’s 95.3 set a 19-month low.
The job openings sub-index, in the meantime, dropped a point m/m in August to 35, with May’s 29 at a six-year low. In other words, there is a slight upward tilt recently in job openings. Not so in compensation plans, with August down a point m/m to 18, just a point above June’s 17, which is the lowest since December 2020.
For the most part, these two sub-indexes historically correlate well directionally, so the most recent divergence between the two may not last (Chart 6). Or it may simply mean one of the two is lying. Logically, if the openings get filled, it could put upward pressure on wages, which is not what these businesses are planning for.
Comments
Log in or sign up to join the conversation.