
Equities Talking Points:
- What Would Impact S&P 500 and Dollar More: Emerging Market Crisis or Eased Trade War?
- Dow Tests Short-Term Support as Month-End Nears.
NOT A SUMMER FOR LULLS, BUT WE NEAR THE END NONETHELESS
US stocks have started to show some element of pullback as we wind down the week, and this comes on the heels of a breakout to fresh highs that ran into Wednesday trade. As we looked at in the Dow yesterday morning, the backdrop was starting to feel ripe for a pullback and that’s continued to play out as close the doors on the month of August. But – those bullish themes in US stock remain attractive while a more questionable backdrop has appeared on number of indices outside of the US. In this article, we’ll take a trip around the globe in looking at stocks in the UK, Europe and Japan to go along with US issues.
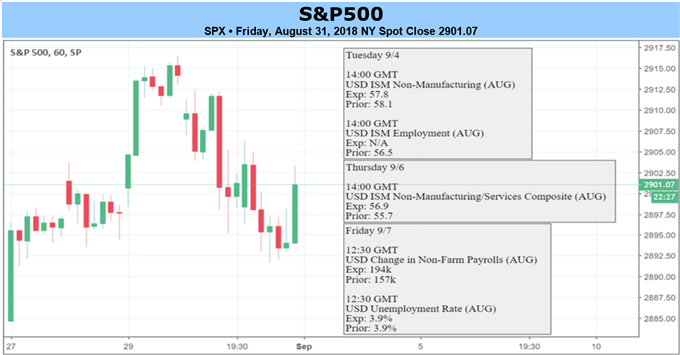
Next week brings a number of interesting items on the economic calendar, and it’s important to note that next week begins with a holiday in the United States. Monday marks Labor Day, which is commonly looked at as the end of the summer months and the return of liquidity to financial markets as traders arrive back at their desk to finish out the year.
S&P 500 ACCELERATING UP-TREND PUSHES UP TO FRESH ALL-TIME HIGHS
The first part of the week was marked with strength, and the final two days saw prices pullback from fresh all-time-highs. Given the veracity of the move over the past two months, traders would likely want to move forward with a bullish bias at this point, as topside structure remains intact and, as of yet, has shown no signs of giving way. This puts focus on potential areas of higher-low support for strategies of bullish continuation, with the obvious next point of interest at the prior all-time-high around 2875.
This level can be somewhat of a trap, however, as it’s a very obvious swing-point on the chart that didn’t really elicit much for resistance as prices were working higher. Last Friday saw prices close below this level and then this Monday, prices gapped-above and didn’t even check back for support; so its usability moving-forward remains in question. The price that does carry some attraction for long strategies is around 2860, as this was a batch of resistance earlier in the month of August that came-back later in the month. As of yet, we haven’t seen a support check here, and this remains interesting for higher-low support.
Bullish structure can remain intact and topside strategies favored with prices remaining above late-July/early-August support zone.
S&P 500 Outlook: Bullish
S&P 500 DAILY PRICE CHART: DEEPER SUPPORT POTENTIAL AROUND PRIOR HIGHS OF 2860
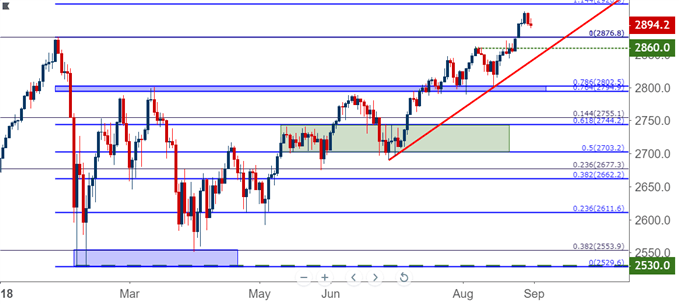
Chart prepared by James Stanley
DOW JONES TESTS HIGHER-LOW SUPPORT
A similar theme of strength has been showing in the Dow Jones over the past two months, and we’ve been following this with a series of setups designed for bullish continuation. Most recently, we published a report yesterday looking for a deeper pullback before looking for the trend to push-higher. Prices are now testing the first area of support that we were looking for, taken from the prior swing-high around 25,886. This keeps the door open for topside plays, particularly if this support holds into the new week, which would be starting on Tuesday in the United States considering the Monday holiday.
If we do see a steeper drop, that bullish approach can remain as valid as we have deeper support potential around prior swings of 25,695 and 25,500, as we looked at earlier in the month of August. A bearish break back-below 25k, which helped to provide a workable support bounce that we looked at a couple of weeks ago, would bring the bullish trend into question.
Dow Jones Outlook: Bullish
DOW JONES FOUR-HOUR PRICE CHART: TESTING SUPPORT AT PRIOR RESISTANCE
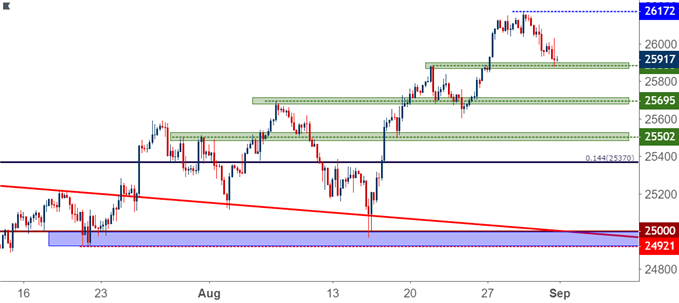
Chart prepared by James Stanley
GERMAN DAX SEEKS DIRECTION AFTER RESISTANCE AT PRIOR SUPPORT
It’s been a rocky past few months in the DAX. After bottoming out in March, with support coming-in around the 38.2% Fibonacci retracement of the three-year major move, prices spent the next two months trending-higher. But the month of May marked a period of reversal for European price action, as pressure in Italian politics began to show across European markets and this created a number of question for forward-looking economic conditions. Since May, we’ve seen a slow grind-lower in the DAX, with prices holding above the 12k psychological level but bears showing no signs of yet letting up.
This week saw a reversal at a big level of confluent resistance in the index as prices posed a turn-around at the 23.6% retracement of that three-year major move, and this also lines up with a bullish trend-line that’s held the lows in the index from early-2016 up until a few weeks ago. This keeps the door open for short-term bearish strategies with targets directed towards 12k, followed by 11,727, which is the 38.2% retracement of the same major move mentioned above.
DAX Outlook: Bearish
DAX WEEKLY PRICE CHART: BEARISH REACTION AT A BIG LEVEL
Chart prepared by James Stanley
FTSE 100: SELLERS ATTACK, DRIVE TO FOUR-MONTH LOW
It’s been a nasty show in the FTSE this week as prices spent the entirety of the period in some form of sell-off. After a banking holiday in the UK on Monday, sellers came-in on Tuesday and continued to push throughout the week until, eventually, we had a fresh four-month low.
The resistance level that we looked at two weeks ago at 7775 continues to hold, and the bullish trend-line that was previously helping to hold the lows has now been eviscerated by sellers. This keeps the index in a bearish spot, and the potential for resistance at prior Fibonacci support can keep the door open for down-side approaches, looking for a bearish test of the 50% marker of the March-May major move at 7375.
FTSE Outlook: Bearish
FTSE DAILY PRICE CHART
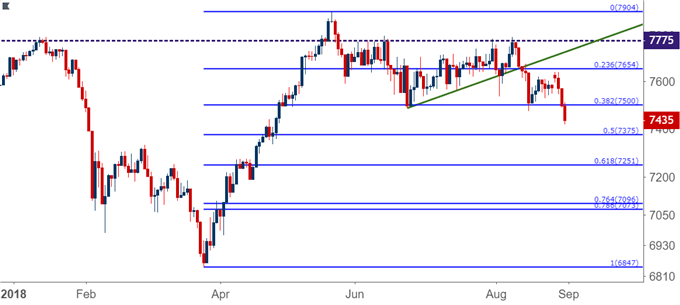
Chart prepared by James Stanley
NIKKEI: LONG-TERM CONCERNS AS MID-POINT OF 28-YEAR MOVE REMAINS IN PLAY
The Nikkei has spent the bulk of this summer further building into a long-term ascending wedge pattern, with resistance being taken from a very interesting area on the charts. The level of 22961 is the 50% marker of the 1990-2009 major move in the Nikkei, and for the past three months – this level has been hardened resistance for the index.
NIKKEI MONTHLY CHART: RESISTANCE AT 50% MARKER OF THE 20-YEAR MOVE
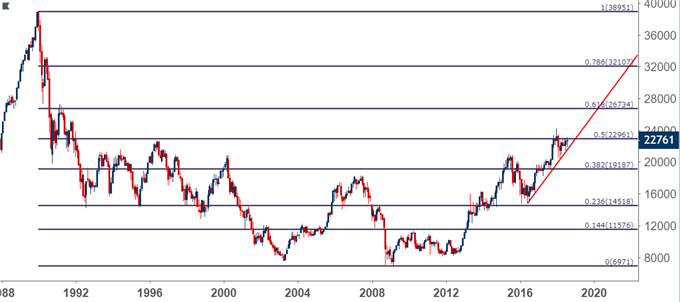
Chart prepared by James Stanley
On the other side of price action, support continues to hold at higher-lows, as we’ve seen since the earlier-year pullback bottomed out in mid-March. This retains a bullish bias for the Nikkei, even with this horizontal area of resistance coming into play and holding through the past three months.
NIKKEI WEEKLY PRICE CHART: THREE MONTHS OF BUILDING RESISTANCE AT KEY LONG-TERM LEVEL
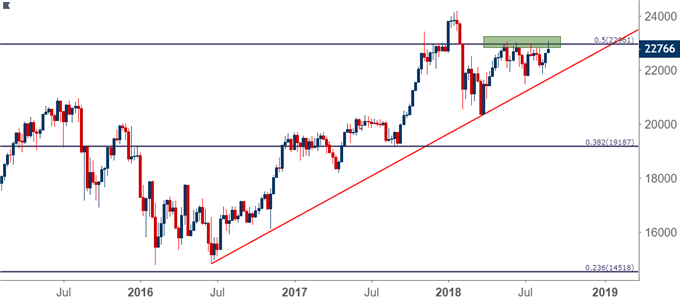
Chart prepared by James Stanley
BULLISH NIKKEI POTENTIIAL
Yesterday saw a false breakout at this level, which indicates deeper pullback potential. This sets the stage for traders to approach bullish strategies on the index in one of two ways: Looking to get long on topside breaks to fresh highs, looking at entry either above the Fibonacci marker or Thursday’s high. Alternatively, traders can look for a deeper pullback after yesterday’s false breakout; looking to take prices back up to resistance, at which point stops can be adjusted to break-even. This would open the door for a possible breakout setup with stops at break-even, so if we do end up with another false breakout, damage can be largely mitigated by the adjusted stop. We look at three possible support areas on the Daily Chart of the Nikkei below.
Nikkei Outlook: Bullish
NIKKEI DAILY PRICE CHART: HIGHER-LOW SUPPORT POTENTIAL FOR BULLISH CONTINUATION STRATEGIES
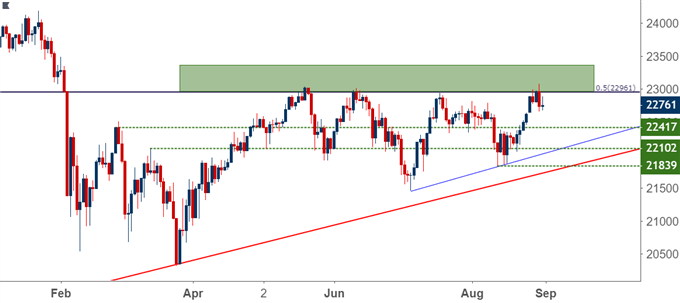
Chart prepared by James Stanley


Comments
Log in or sign up to join the conversation.