


Image Source: Unsplash
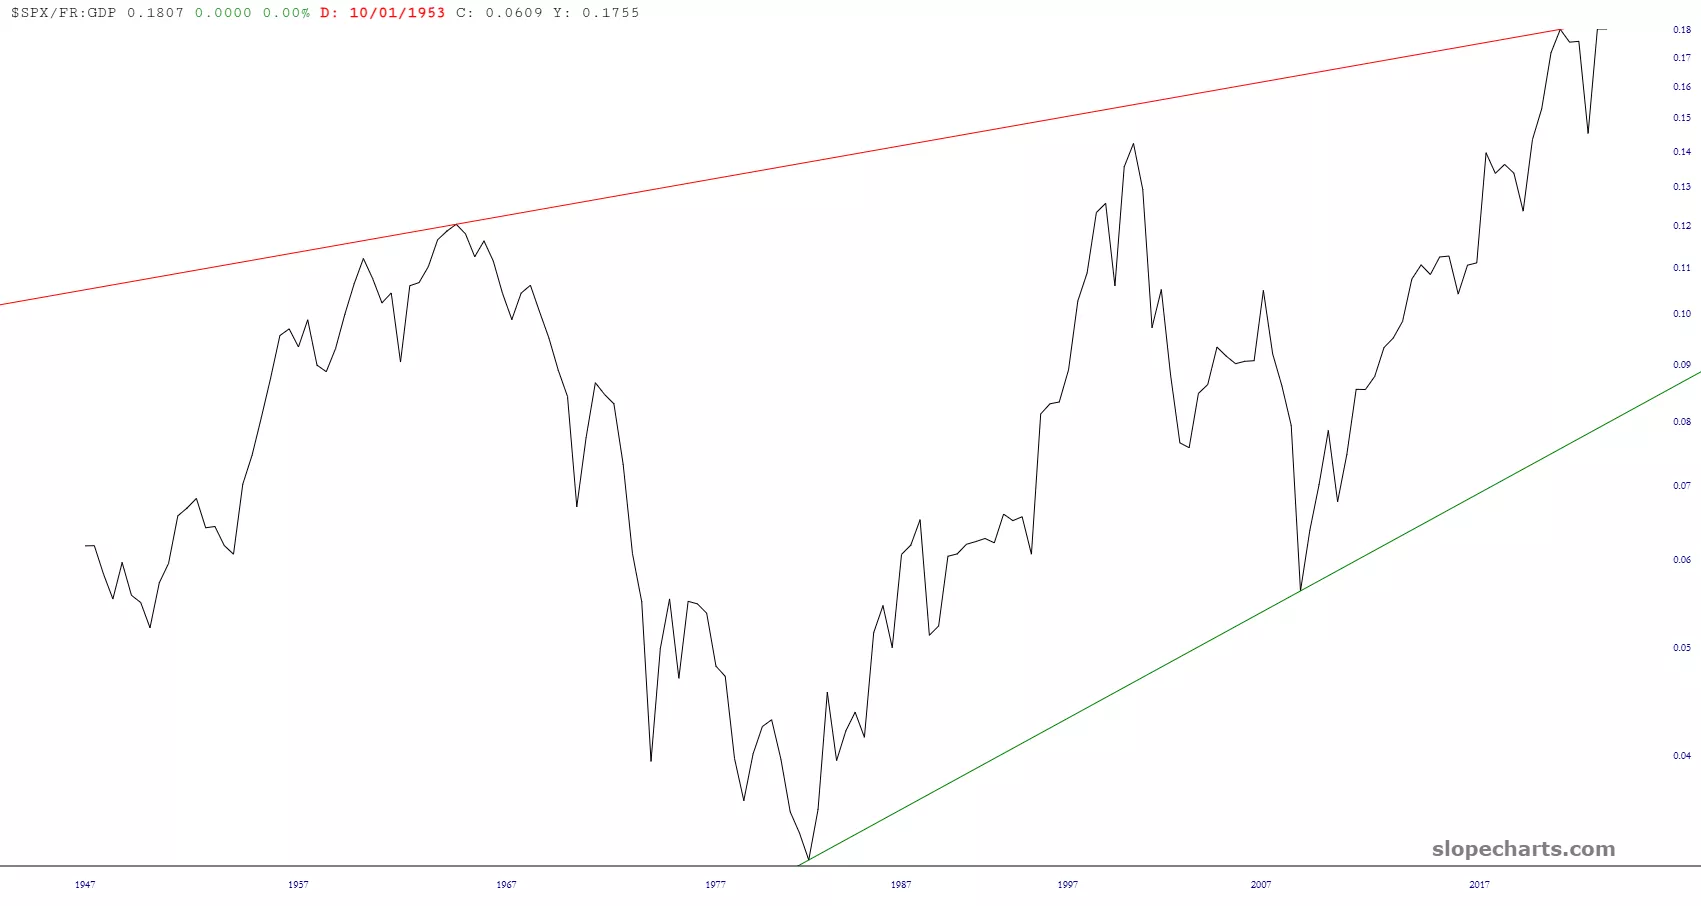
Below is a ratio chart of the S&P 500 divided by the Gross Domestic Product since 1947. It has never been higher. It’s higher than it was in the “Nifty 50” error of the mid 1960s. It’s higher than the absolutely peak of the Internet Mania of 2000.
And you know something else? The GDP data hasn’t updated since Q1 or this year, so 4/1/2024 is the most recent data. It’s even HIGHER now! Suffice it to say, this is going to end really, really, REALLY badly.
(Click on image to enlarge)
More By This Author:
A Little Cost Slippage
The New MU Revue
Let There Be Darkness

Comments
Log in or sign up to join the conversation.