

EQNR has established a long-term bullish trend after printing a fresh all-time high on 23 October. The stock has since pulled back, and if that decline proves corrective, traders will have another opportunity to buy at lower prices. In this EQNR Elliott Wave analysis, we review the long-term structure, the important support area, and the targets that matter.
About Equinor (NYSE: EQNR)
Equinor ASA is a Norway-based global energy company and one of the world’s leading offshore oil and gas producers. Alongside its traditional energy business, the company has expanded aggressively into offshore wind, carbon capture, and other low-carbon initiatives. This has positioned EQNR as a diversified energy stock for long-term investors.
EQNR Elliott Wave Analysis – Weekly Chart
EQNR recently reached its highest price since 2008, completing its first full bullish cycle since inception as wave (I). Wave (I) ended in May 2008 at $43.30. As the weekly chart shows, wave (II) then unfolded as a double zigzag correction that took nearly 12 years to complete, bottoming in March 2020 near $8.40.
From that low, the stock surged to $42.50 in August 2020, completing wave I of (III) as a clear impulse structure. Wave II of (III) followed as a correction of that surge, finishing another double zigzag at $21.40 in April 2025. A second powerful impulse rally then carried EQNR to its current record high of $49 in October 2026.
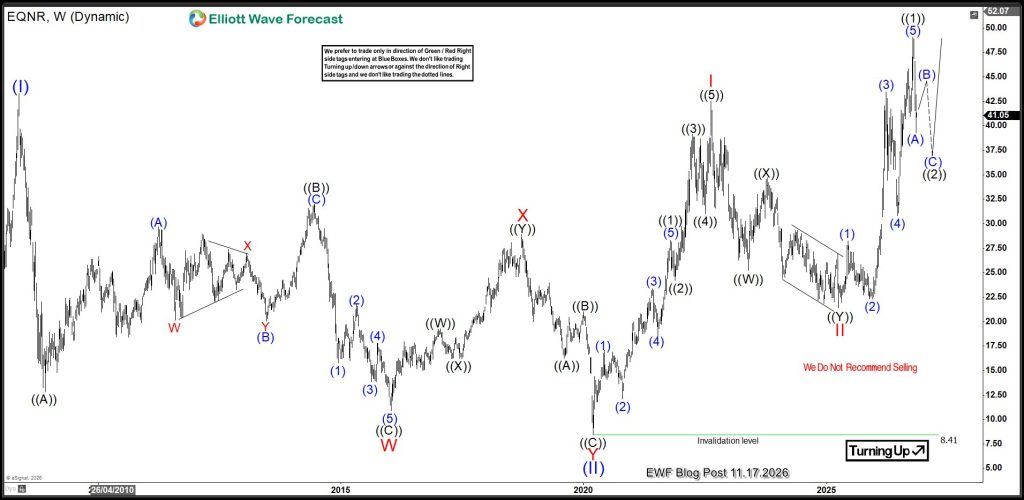
This price history shows the stock respecting Ralph Elliott’s core principle: a five-wave advance followed by a three-wave pullback. EQNR is also printing higher highs and higher lows, which confirms the broader bullish trend. Elliott Wave theory adds what price action alone cannot: how much rally may remain and where the current price sits in the larger cycle.
Based on this count, the current decline is best labeled wave ((2)) of III of (III). That implies the stock’s bullish potential remains substantial, with further upside expected once the pullback completes.
EQNR Elliott Wave Analysis – Daily Chart
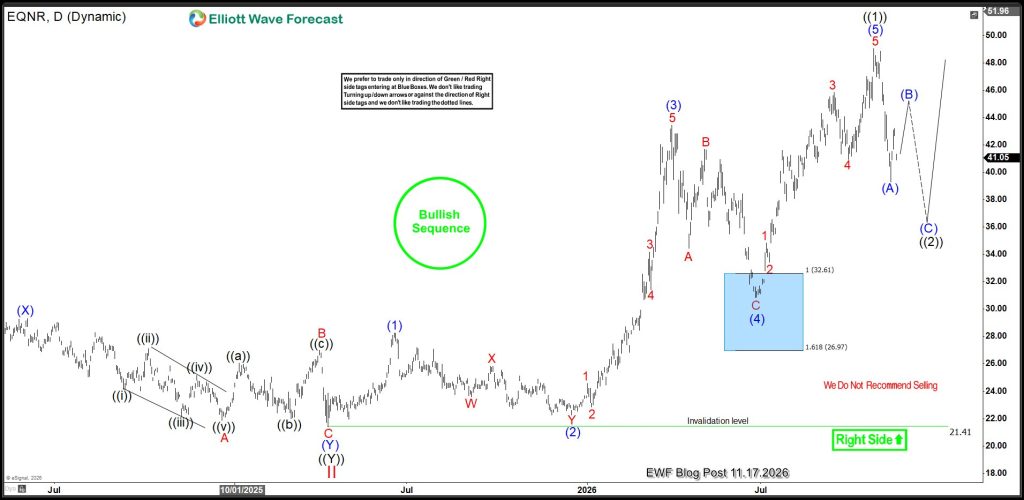
The daily chart breaks down the sub-waves from the wave II low. Buyers stepped in at a blue box for wave (4), and an impulse sequence launched from that zone to a new high. This confirms a complete five-wave impulse from the $21.41 pivot, where wave II ended and wave III began.
EQNR Trading Outlook: Where Buyers May Step In
Traders should watch for any meaningful pullback in EQNR. The current decline in wave ((2)) offers a potential trade setup. Price appears to have completed wave (A) of ((2)) and is now in a wave (B) rebound. One more leg lower is expected to finish wave ((2)) and present fresh buying opportunities from the blue box.
EQNR traders should keep this stock on their radar. I will update this blog when a blue box forms for wave ((2)), or if the stock develops another setup worth tracking.
Source: https://elliottwave-forecast.com/stock-market/eqnr-elliott-wave-analysis-record-high/



Comments
Log in or sign up to join the conversation.