

From election day, five year inflation breakeven up 33 bps; EPU up 231. What could go wrong?
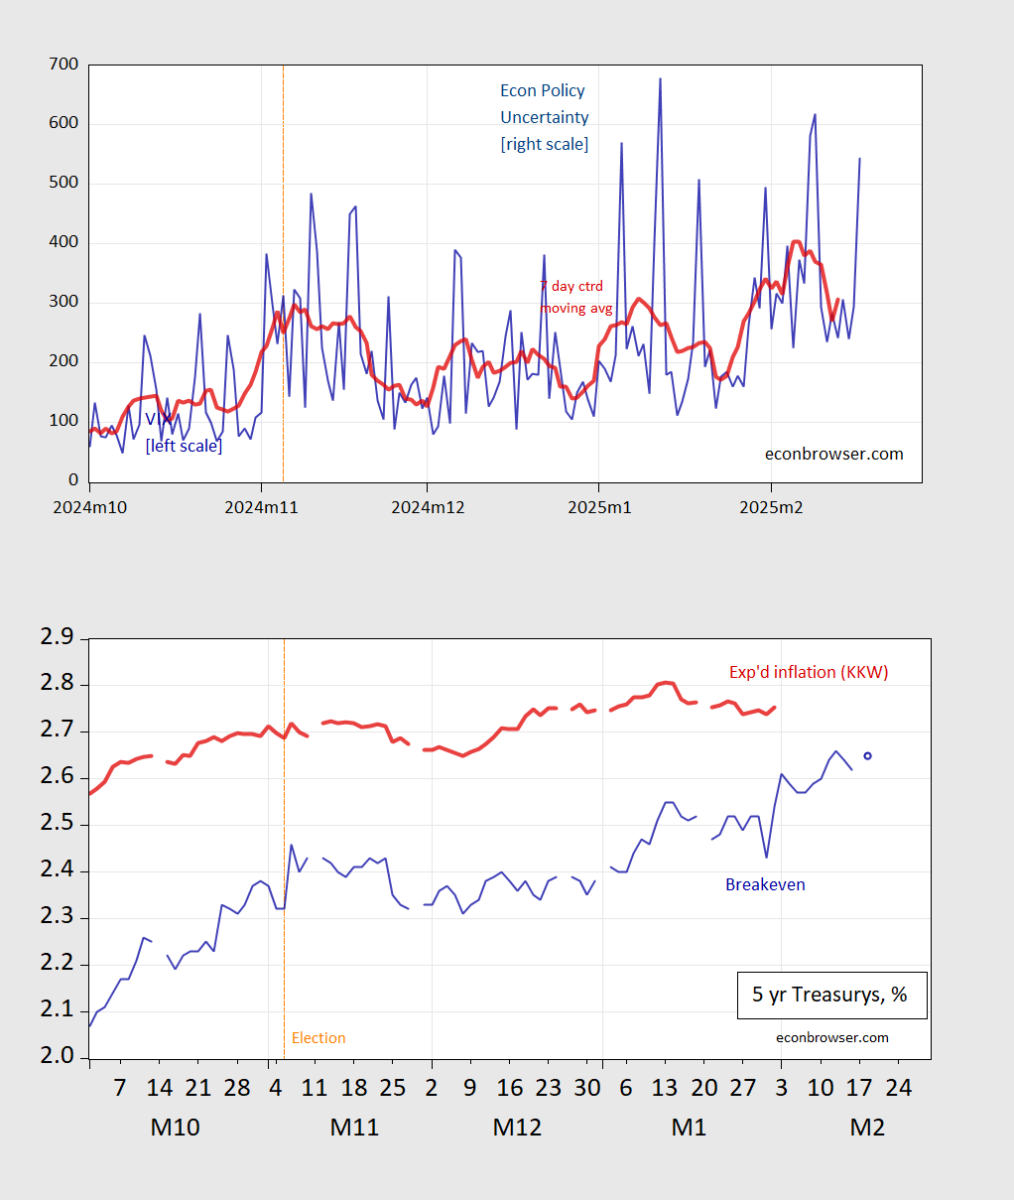
Figure 1: Top graph – EPU (blue), 7 day centered moving average (red); bottom graph – five year Treasury-TIPS breakeven (blue), and KKW estimate of five year inflation (red), both in %. Source: policyuncertainty.com and Treasury via FRED and author’s calculations.
More By This Author:
The Russian Economy: How Many Contingent Liabilities?Economists, Some Consumers, Believe Y/Y Inflation Will Rise
Food Prices – CPI: At Home, PPI



Comments
Log in or sign up to join the conversation.