

Good evening folks, good to have you back!
I came across a very interesting chart today, and I think it is worth contemplating for a moment.
It is from Yardeni research, their research and charting is a treasure trove, you should check it out.
Heres the chart,

You are looking at the last 20 years of the S&P500 charted with buybacks and dividends.
The buyback cycle goes something like this - Corporate boards buyback their own stock in proportion to the general cycle of bullish and bearish market sentiment.
Corporate buy backs increase with a bull market and decrease with bear market.
You will notice that buybacks in S&P 500 companies topped out in Q1 2016, And have pretty much stagnated since. They have stagnated at an extreme high mind you, so it's not as if corporations have suddenly turned frugal with their cash!
It is interesting though, valuations are so extreme now, that even corporations have stopped chasing this market!
It looks like this is another indication of the change of trend to come. This willing buyer of stock, may well now turn into an active seller in the coming downtrend.
Lets put this one in the 'should have seen it coming' bucket, along with everything else!
Lets get down to it.
UPCOMING RISK EVENTS:
USD: N/A.
EUR: Final CPI y/y.
GBP: CPI y/y,
JPY: N/A.
EURUSD
30 min

4 Hours
Daily
My Bias: long term bearish
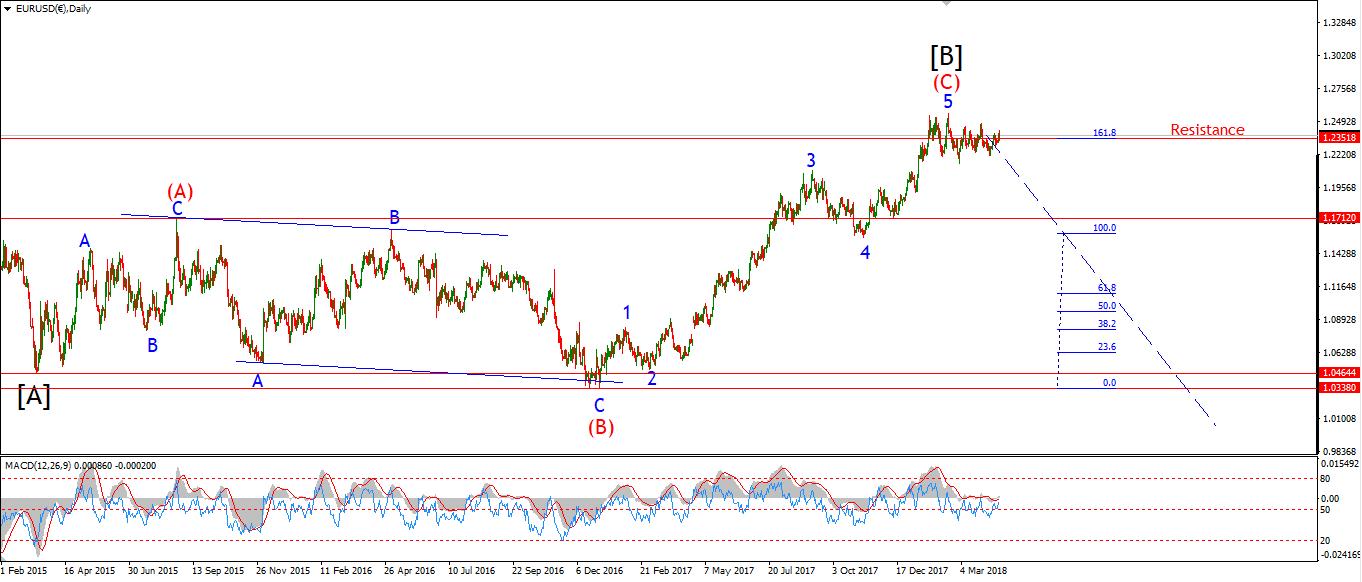
Wave Structure: Topping in wave [B] black.
Long term wave count: lower in wave [C] black.
EURUSD is looking weak across the board, and I think it is time to seriously consider the bearish alternate count.
On the daily chart, we see a clear bearish momentum divergence we could now be entering into a possible cyclical downswing in momentum.
This is occurring off three year highs in overbought extremes! So I am sitting up and taking notice.
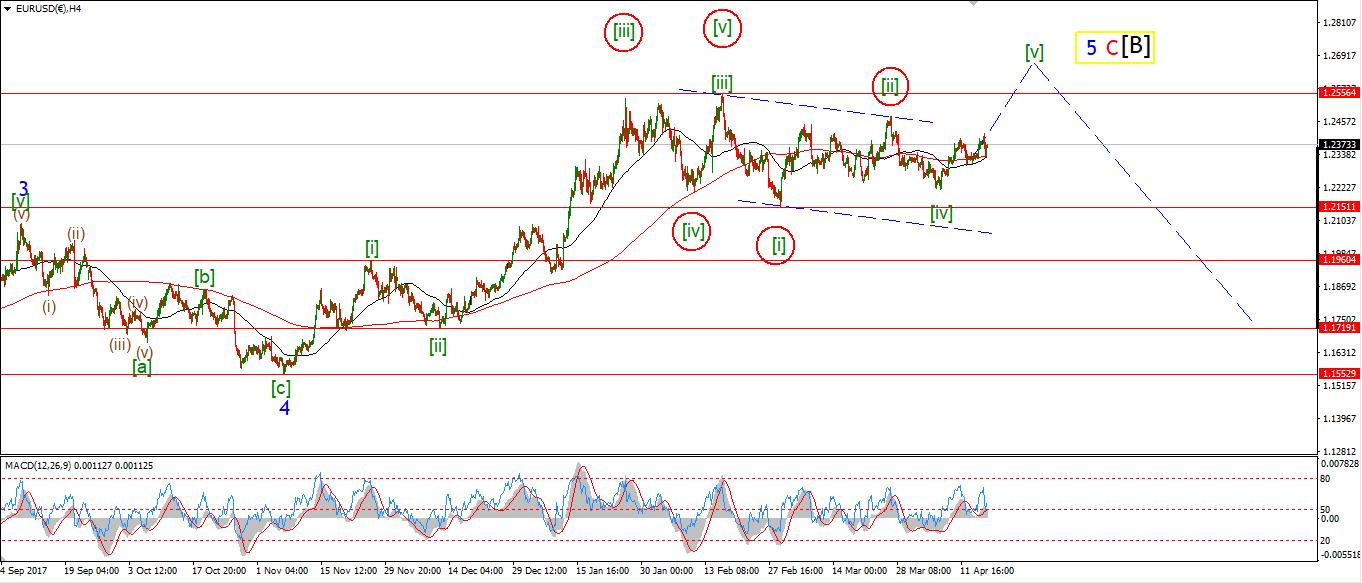
The 4hr chart shows a possible complete five wave pattern at the high of 1.2556. The price has limped along since then with a series of lower highs.
The short term chart shows a possible (i) (ii) pattern into today's highs, with a complete three wave rise at today's high.
So, if we see a five wave decline off today's high at 1.2413. Followed by a three wave rally to a lower high, that will complete a bearish Elliott wave signal
and the beginning of the end for EURUSD!
Tomorrow, 1.2476 must hold at the previos high, watch for a five wave decline to begin off 1.2413.
GBPUSD
30 min

4 Hours
Daily
My Bias: short below parity in wave (5).
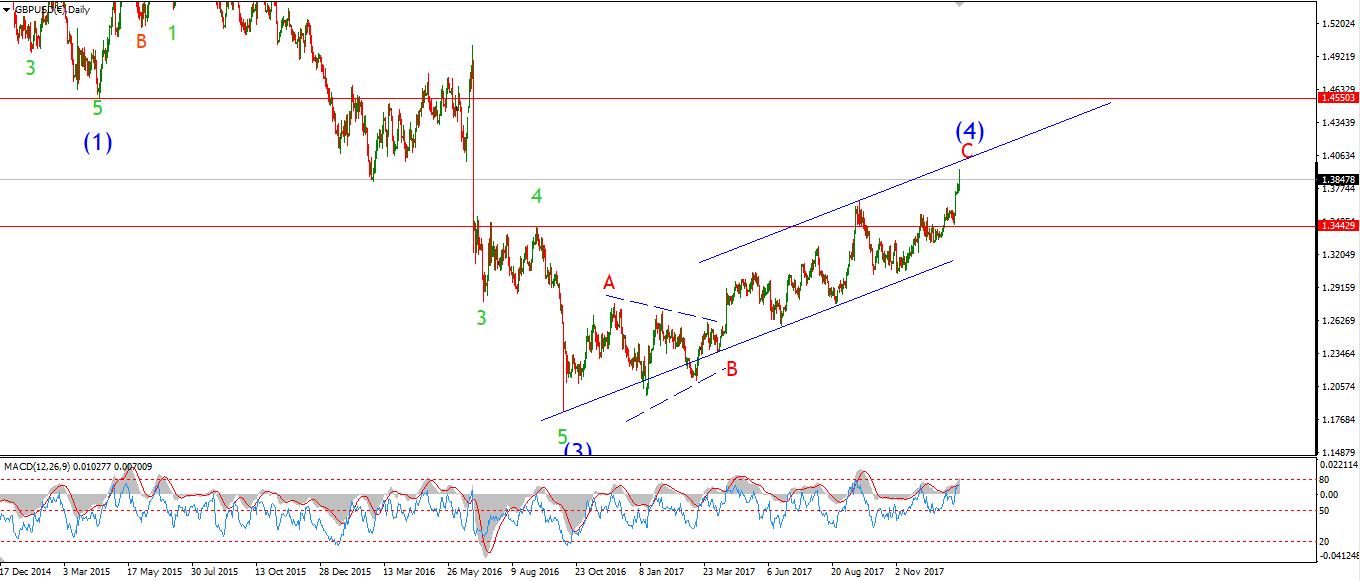
Wave Structure: completing wave (4) blue correction higher.
Long term wave count: decline in wave (5) blue, below parity
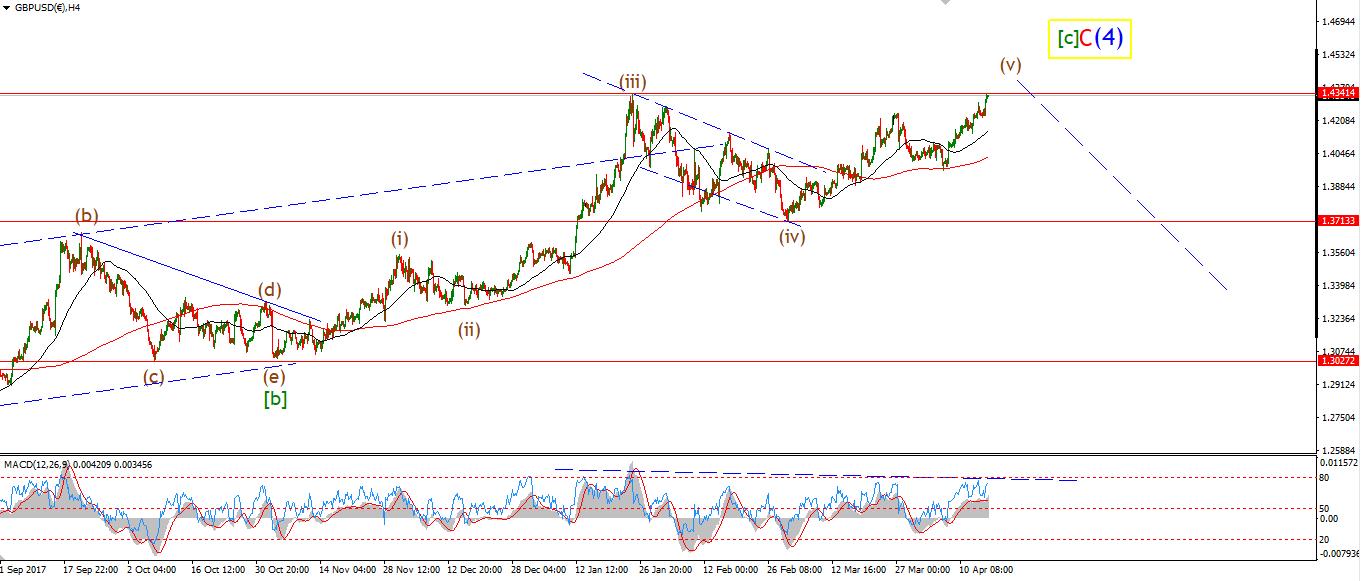
The trend channel intersection was suggested a high in wave (v) at 1.4388, the price high of today's session reached 1.4376. And the price has declined in a possible impulse wave off that high.
It is early days yet but, we have a comlete five wave pattern in wave (v) brown visible on the chart.
Which completes the larger correction. We could be looking at a completed correction in wave (4) blue at today's high.
1.3964 marks the low of the previous wave (iv), this is now key support in the short term.
If price breaks below 1.3964, it will be a major sign that cable has topped out.
Tomorrow, I will be watching the previous wave 'iii' high at 1.4244,
If that level breaks with a five wave decline off the high, then things will get very interesting.



Comments
Log in or sign up to join the conversation.