

Canadian midstream is a classic dividend investor playground. Long-term contracts, tolls instead of commodity exposure, irreplaceable assets, and dividend growth backed by real cash flow.
Three names dominate the space: Enbridge (ENB), TC Energy (TRP), and Pembina Pipeline (PPL). Same sector, same business model on paper, three different dividend profiles.
Here is how I rank them, and why.
*Disclosure: I do not own ENB, TRP, or PPL. This is education, not advice. Do your own due diligence.
How I compare midstream stocks
Before I rank anything, I run every candidate through the same checklist:
The Dividend Triangle: revenue growth, EPS growth, and dividend growth over five years. For midstream, EPS is the weakest signal because the business runs on long-lived assets with heavy depreciation. I weigh cash flow and dividend history more.
Dividend safety: payout ratio, cash payout ratio, and dividend history. Important trap: midstream GAAP payout ratios often look stretched. Management reports against distributable cash flow (DCF) instead. Always check that number.
Balance sheet: debt to EBITDA, credit score. Midstream companies finance their growth with debt. A 4 to 5 times leverage range is normal. Above 6 is the watch item.
Yield vs. history: if the forward yield sits above the 5-year average, the stock may be trading at a better entry point than usual. All three pipelines have run up, so this metric matters.
No spreadsheet tricks. Just discipline.
The scorecard
One note before the numbers. For midstream, two rows carry more weight than the rest. Debt-to-EBITDA shows how much leverage each name carries, and because pipelines fund their growth with debt, it is the metric that determines who holds up in a downturn. The GAAP payout ratio is the trap: on a midstream company, it always looks stretched, because heavy depreciation distorts the earnings it is measured against. Read it next to distributable cash flow, not on its own.
Metric | ENB | TRP | PPL |
DSR PRO Rating | 3 | 3 | 3 |
Dividend Safety Score | 3 | 3 | 3 |
Forward Yield | 5.15% | 3.80% | 4.55% |
Average 5-Yr Yield | 6.60% | 5.80% | 5.55% |
5-Yr Revenue Growth | 9.10% | 3.15% | 1.85% |
5-Yr EPS Growth | 1.50% | 11.10% | 0.00% |
5-Yr Dividend Growth | 3.05% | 0.55% | 27.80% |
GAAP Payout Ratio | 117.10% | 97.90% | 105.70% |
Consecutive Years of Dividend Increases | 31 | 26 | 3 |
Debt/EBITDA | 6.65 | 6.25 | 3.90 |
Credit Score | 65 | 80 | 66 |
Source: Dividend Stocks Rock stock cards, Q2 2026 review.
Now let me walk through why each one lands where it does.
#3: Pembina Pipeline (PPL)
Pembina is the smallest of the three. It runs a diversified midstream portfolio in Western Canada and the Bakken, with gas gathering, fractionation, storage, and an LNG export option through the Cedar LNG joint venture with the Haisla Nation.
On paper, Pembina has the best balance sheet of the group. Debt to EBITDA sits at 3.90, well below its peers. Management targets 5% to 7% fee-based EBITDA per share growth through 2030.
So why is it third?
Because the dividend track record is the shortest. Pembina cut its dividend in 2020 and only resumed annual increases in 2022. The current streak is three years. We also note the company has no formal economic moat and a history of overpaying for acquisitions.
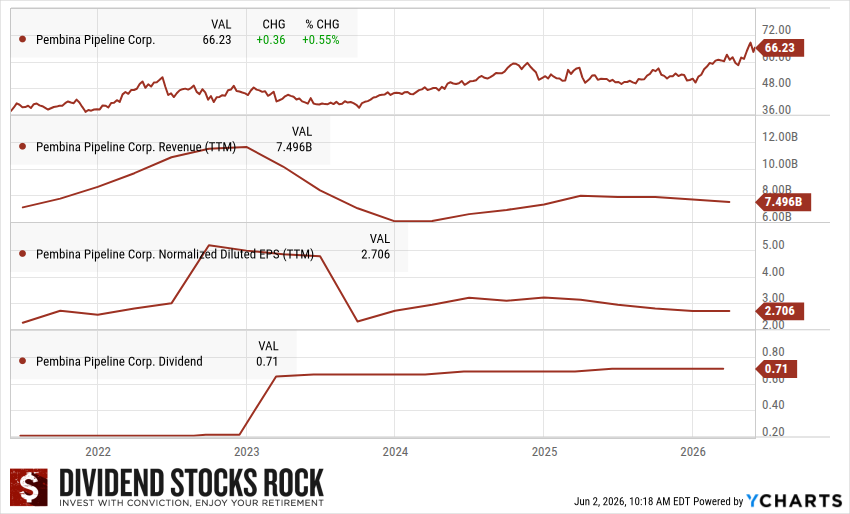
Pembina Pipeline (PPL.TO) 5-year Dividend Triangle chart
A note for U.S. readers: do not confuse Pembina with PPL Corp, the U.S. utility. On the NYSE, Pembina trades under PBA.
#2: TC Energy (TRP)
TC Energy is now a focused natural gas pure-play after spinning off its oil pipeline business as South Bow (SOBO) in October 2024. The new TRP runs more than 60,000 miles of natural gas pipelines, plus the Bruce Power nuclear stake.
About 95% of earnings sit under regulated or long-term contracts. Management guidance for 6% EBITDA growth through 2028 and 3%-5% dividend growth going forward. The natural gas demand backdrop is strong: U.S. Heartland demand is expected to grow 40% through 2035, driven by data centers, LNG exports, and power generation.
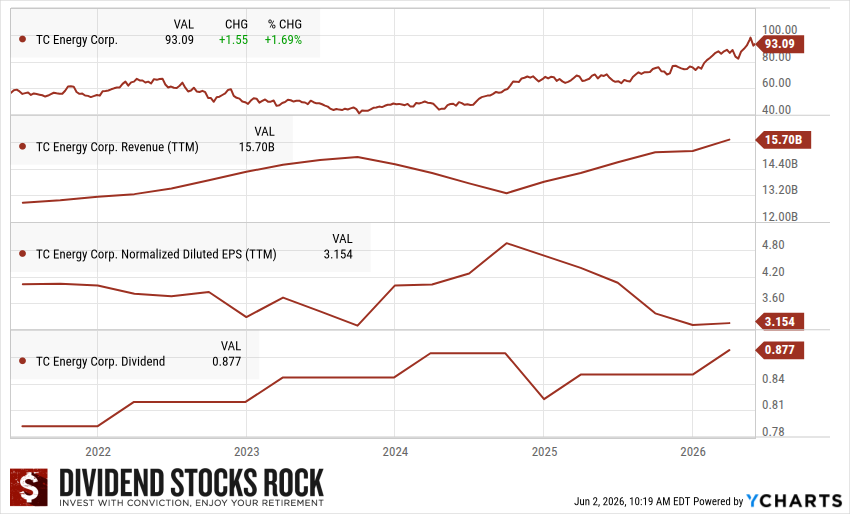
TC Energy (TRP.TO) 5-year Dividend Triangle chart
The 26-year dividend streak survived the South Bow spinoff. The 2024 dividend “decrease” you may see in databases was the proportionate adjustment for the spinoff, not a cut. Shareholders received South Bow shares to make up the difference.
Watch-items: debt to EBITDA at 6.25 is at the high end, the GAAP payout ratio is stretched at 97.90%, and the forward yield (3.80%) sits well below the 5-year average of 5.80%. The stock has run up. The entry point is not what it used to be.
#1: Enbridge (ENB)
Enbridge wins on scale, moat, and dividend history.
The Mainline system moves roughly 70% of Canadian oil pipeline volume. The company also operates North America’s largest natural gas distribution business following the 2024 acquisition of three U.S. gas utilities. Add a $40 billion secured capital backlog and another $50 billion in unsanctioned projects, and you have a growth engine that does not depend on the energy cycle.
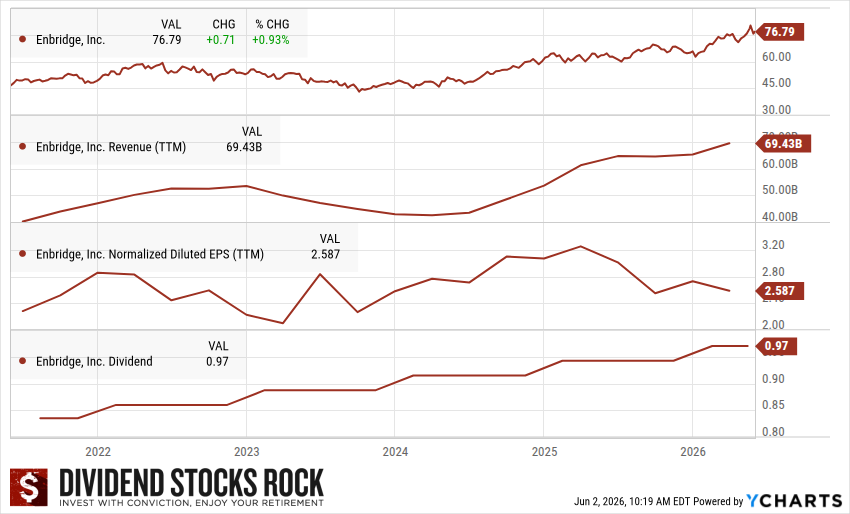
Enbridge (ENB.TO) 5-year Dividend Triangle chart
On dividends, ENB just raised its payout by 3% in early 2026. That is the 31st consecutive annual increase. Management guides for roughly 5% annualized growth through the end of the decade, with about 3% from the dividend.
About the payout ratios: the 117% GAAP payout and 425% cash payout look terrifying. They are not the relevant numbers for midstream. ENB targets a payout ratio of 60% to 70% of distributable cash flow. The full-year 2025 number landed at 66%, right in the middle of the range. Always check the DCF payout, not the GAAP payout.
The watch item is leverage. Debt to EBITDA sits at 6.65 and the credit score is 65, the lowest of the three. Enbridge needs steady cash flow to keep funding its backlog and its dividend. Any operational hiccup gets noticed.
The forward yield of 5.15% sits below the 5-year average of 6.60%. Translation: the stock has run hard. You are paying more for the same business than you used to.
The verdict
For income reliability and scale, ENB is my pick.
For the natural gas restructuring story and faster EBITDA growth, TRP is the more interesting trade if you can live with the debt and the recent run-up.
For the cleanest balance sheet of the group, PPL leads, but the dividend record is too thin to lead a dividend growth portfolio.
All three are PRO 3 with a Dividend Safety Score of 3. None of them is a dividend triangle ace. If you want a pipeline in your portfolio, pick the one that fits the role you are filling.


Comments
Log in or sign up to join the conversation.