

Yesterday’s NYT noted “U.S. Growth and Employment Data Tell Different Stories”:
Measured by traditional yardsticks for growth, like gross domestic product, the American economy definitely looks weak. View it through the prism of hiring and employment, however, and the economy seems surprisingly strong.
“It is a real mystery how you can have nearly 300,000 new jobs created in December with the economy growing by 1 percent or less,” said Torsten Slok, chief international economist for Deutsche Bank Securities in New York. “We can’t have this discrepancy for a long period of time.”
In our 2014 J.Macro paper, Laurent Ferrara, Valérie Mignon and I asked why employment growth was so sluggish given GDP growth (post here). The current situation seems to have reversed that puzzle. Of course, we examined levels (using a nonlinear error correction model), while the current discussion is centered around growth rates. Nonetheless, this is an interesting question.
Figure 1 depicts the employment and growth trends since 2007.
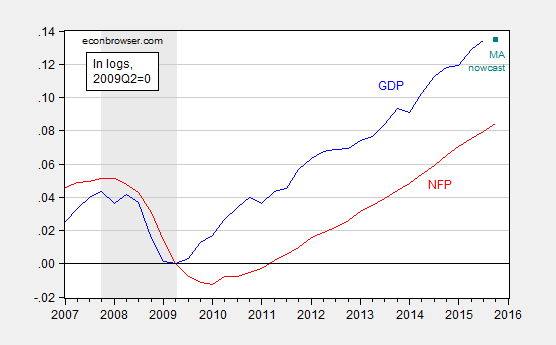
Figure 1: Log real GDP (blue), and nonfarm payroll employment (red), both normalized to 2009Q2=0. 2015Q4 observation is the January 15 Macroeconomic Advisers nowcast. NBER defined recession dates shaded gray. Source: BEA, BLS via FRED, Macroeconomic Advisers, author’s calculations.
It’s hard to see how the two series’ growth rates covary over time, so I show cumulative growth for annual increments since 2009Q2, the last NBER-defined trough.
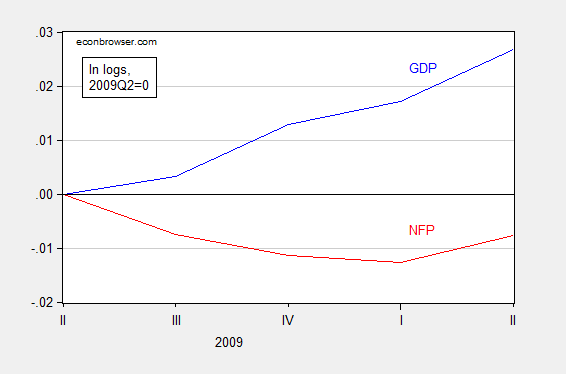
Figure 2: Log real GDP (blue) and nonfarm payroll employment (red), both normalized to 2009Q2=0, 2009Q2-2010Q2. Source: BEA and BLS, and author’s calculations.
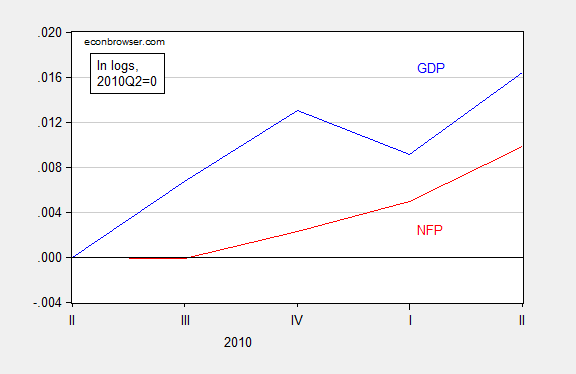
Figure 3: Log real GDP (blue) and nonfarm payroll employment (red), both normalized to 2010Q2=0, 2010Q2-2011Q2. Source: BEA and BLS, and author’s calculations.
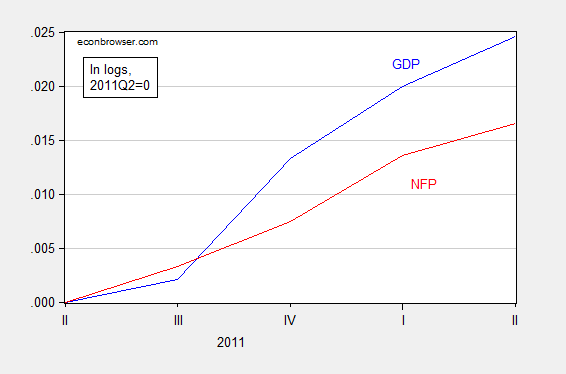
Figure 4: Log real GDP (blue) and nonfarm payroll employment (red), both normalized to 2011Q2=0, 2011Q2-2012Q2. Source: BEA and BLS, and author’s calculations.
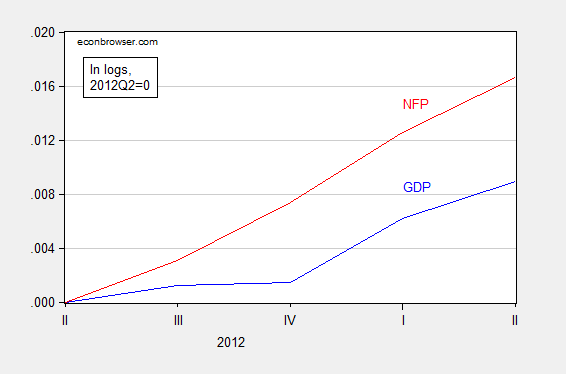
Figure 5: Log real GDP (blue) and nonfarm payroll employment (red), both normalized to 2012Q2=0, 2012Q2-2013Q2. Source: BEA and BLS, and author’s calculations.

Figure 6: Log real GDP (blue) and nonfarm payroll employment (red), both normalized to 2013Q2=0, 2013Q2-2014Q2. Source: BEA and BLS, and author’s calculations.
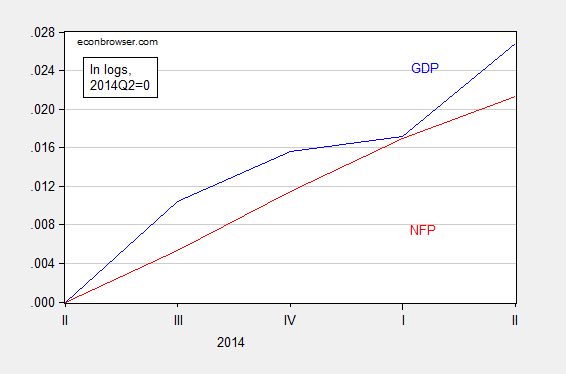
Figure 7: Log real GDP (blue) and nonfarm payroll employment (red), both normalized to 2014Q2=0, 2014Q2-2015Q2. Source: BEA and BLS, and author’s calculations.
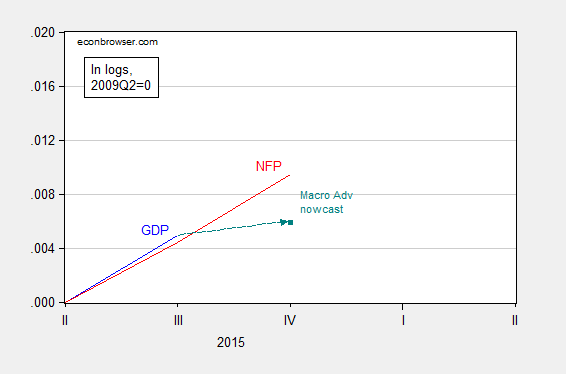
Figure 8: Log real GDP (blue) and nonfarm payroll employment (red), both normalized to 2015Q2=0, 2015Q2-2016Q2. 2015Q4 observation is the January 15 Macroeconomic Advisers nowcast. Source: BEA and BLS, and author’s calculations.
Caveat: The employment series and output series will both be benchmark-revised, so these short run correlations may very well change. For a cautionary note, see this post.
Our point estimates in Chinn, Ferrara and Mignon (2014) indicate that for an expansion regime, the short run elasticity of employment with respect to GDP is about 0.3 (sample up to 2007Q4). Figure 1 shows this correlation for the post recession sample. As Figure 5 indicates, employment outpaced GDP growth from 2012Q2-2013Q2, so the disjuncture shown in Figure 8 is not unprecedented in just the latest recovery. Nonetheless, preliminary results from our model estimated with updated data up to 2013Q4 indicates that employment in 2015Q3 is nearly 1 million above what is predicted by our nonlinear error correction model, confirming more formally the high level of employment growth relative to GDP. (More on these results to come.)


Comments
Log in or sign up to join the conversation.