

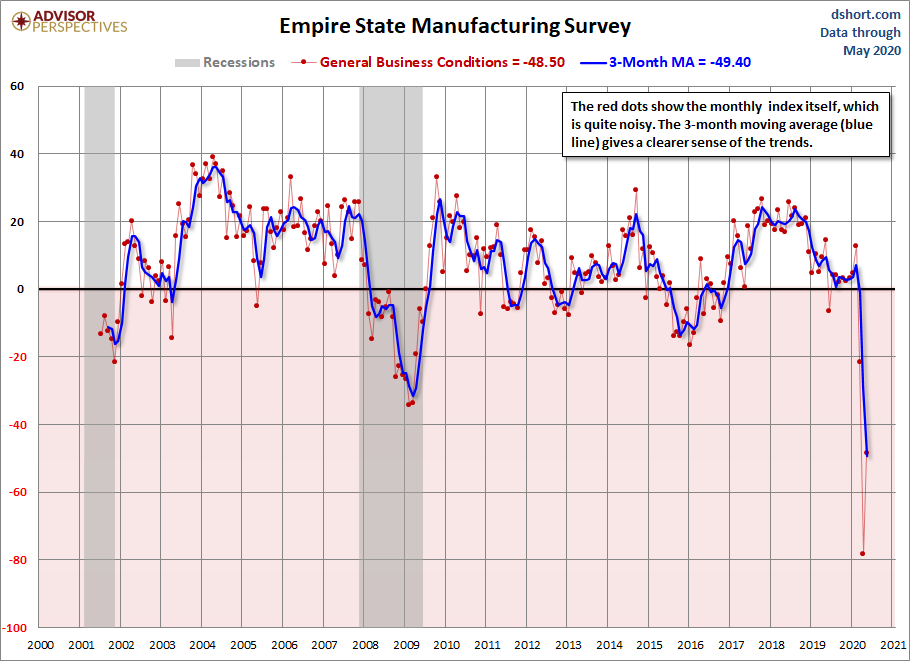
This morning we got the latest Empire State Manufacturing Survey. The diffusion index for General Business Conditions at -48.5 was an increase of 29.7 from the previous month's -78.2. The Investing.com forecast was for a reading of -63.5.
The Empire State Manufacturing Index rates the relative level of general business conditions in New York state. A level above 0.0 indicates improving conditions, below indicates worsening conditions. The reading is compiled from a survey of about 200 manufacturers in New York state.
Here is the opening paragraph from the report.
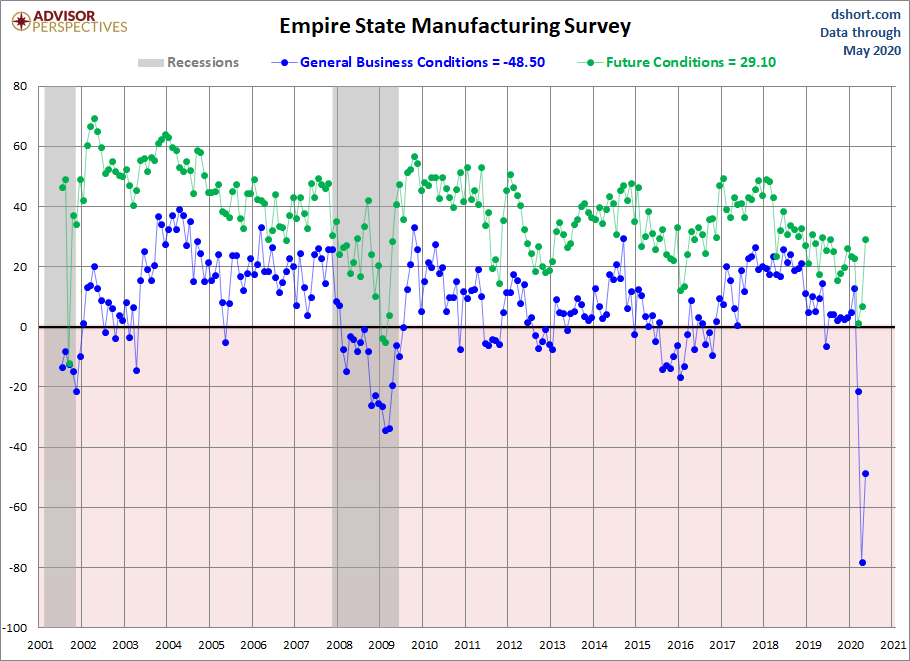
Business activity continued to deteriorate significantly in New York State, according to firms responding to the May 2020 Empire State Manufacturing Survey. The headline general business conditions index climbed thirty points, but remained well below zero at -48.5. New orders and shipments continued to decline sharply, though not as steeply as in April. Delivery times were slightly shorter, and inventories were slightly lower. After plunging last month, employment levels and the average workweek fell further in May. Input prices were slightly higher, and selling prices continued to decline modestly. While current conditions remained extremely weak, firms grew more optimistic that conditions would be better six months from now. [full report]
Here is a chart of the current conditions and its 3-month moving average, which helps clarify the trend for this extremely volatile indicator:
Click this link to access a PDF set of charts of the individual components over the past 12 months.
Since this survey only goes back to July of 2001, we only have one complete business cycle with which to evaluate its usefulness as an indicator for the broader economy. Following the Great Recession, the index has slipped into contraction multiple times, as the general trend slowed. We saw a gradual decline in 2015 that picked up in 2016, with a decline starting in mid- to late-2018.
Here is an overlay of the current and future conditions (a six-month outlook).
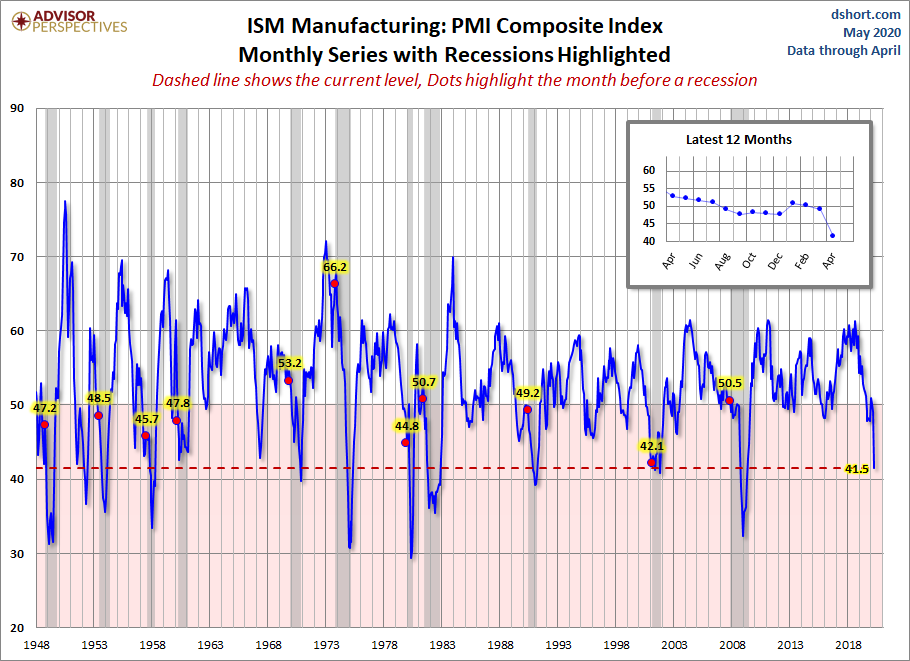
Meanwhile, here's another look at the latest ISM Manufacturing Business Activity Index.
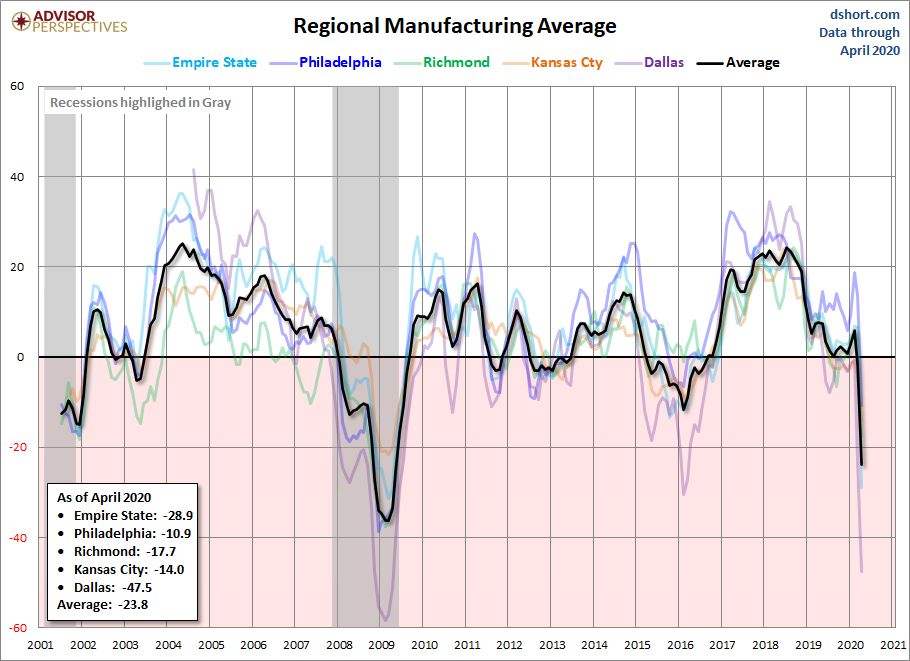
Let's compare all five Regional Manufacturing indicators. Here is a three-month moving average overlay of each since 2001 (for those with data).
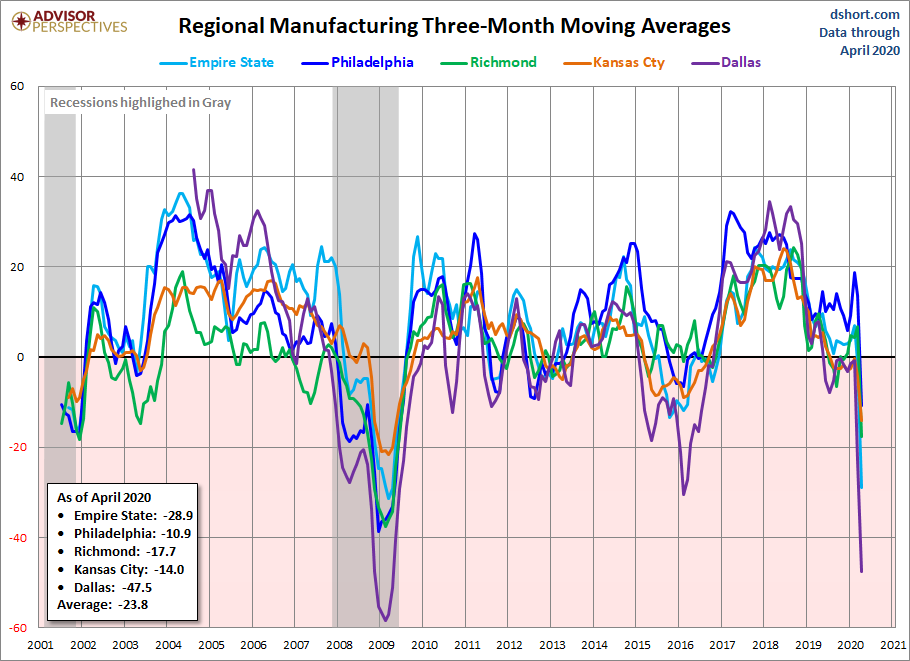
Here is the same chart including the average of the five. Readers will notice the range in expansion and contraction between all regions.



Comments
Log in or sign up to join the conversation.