

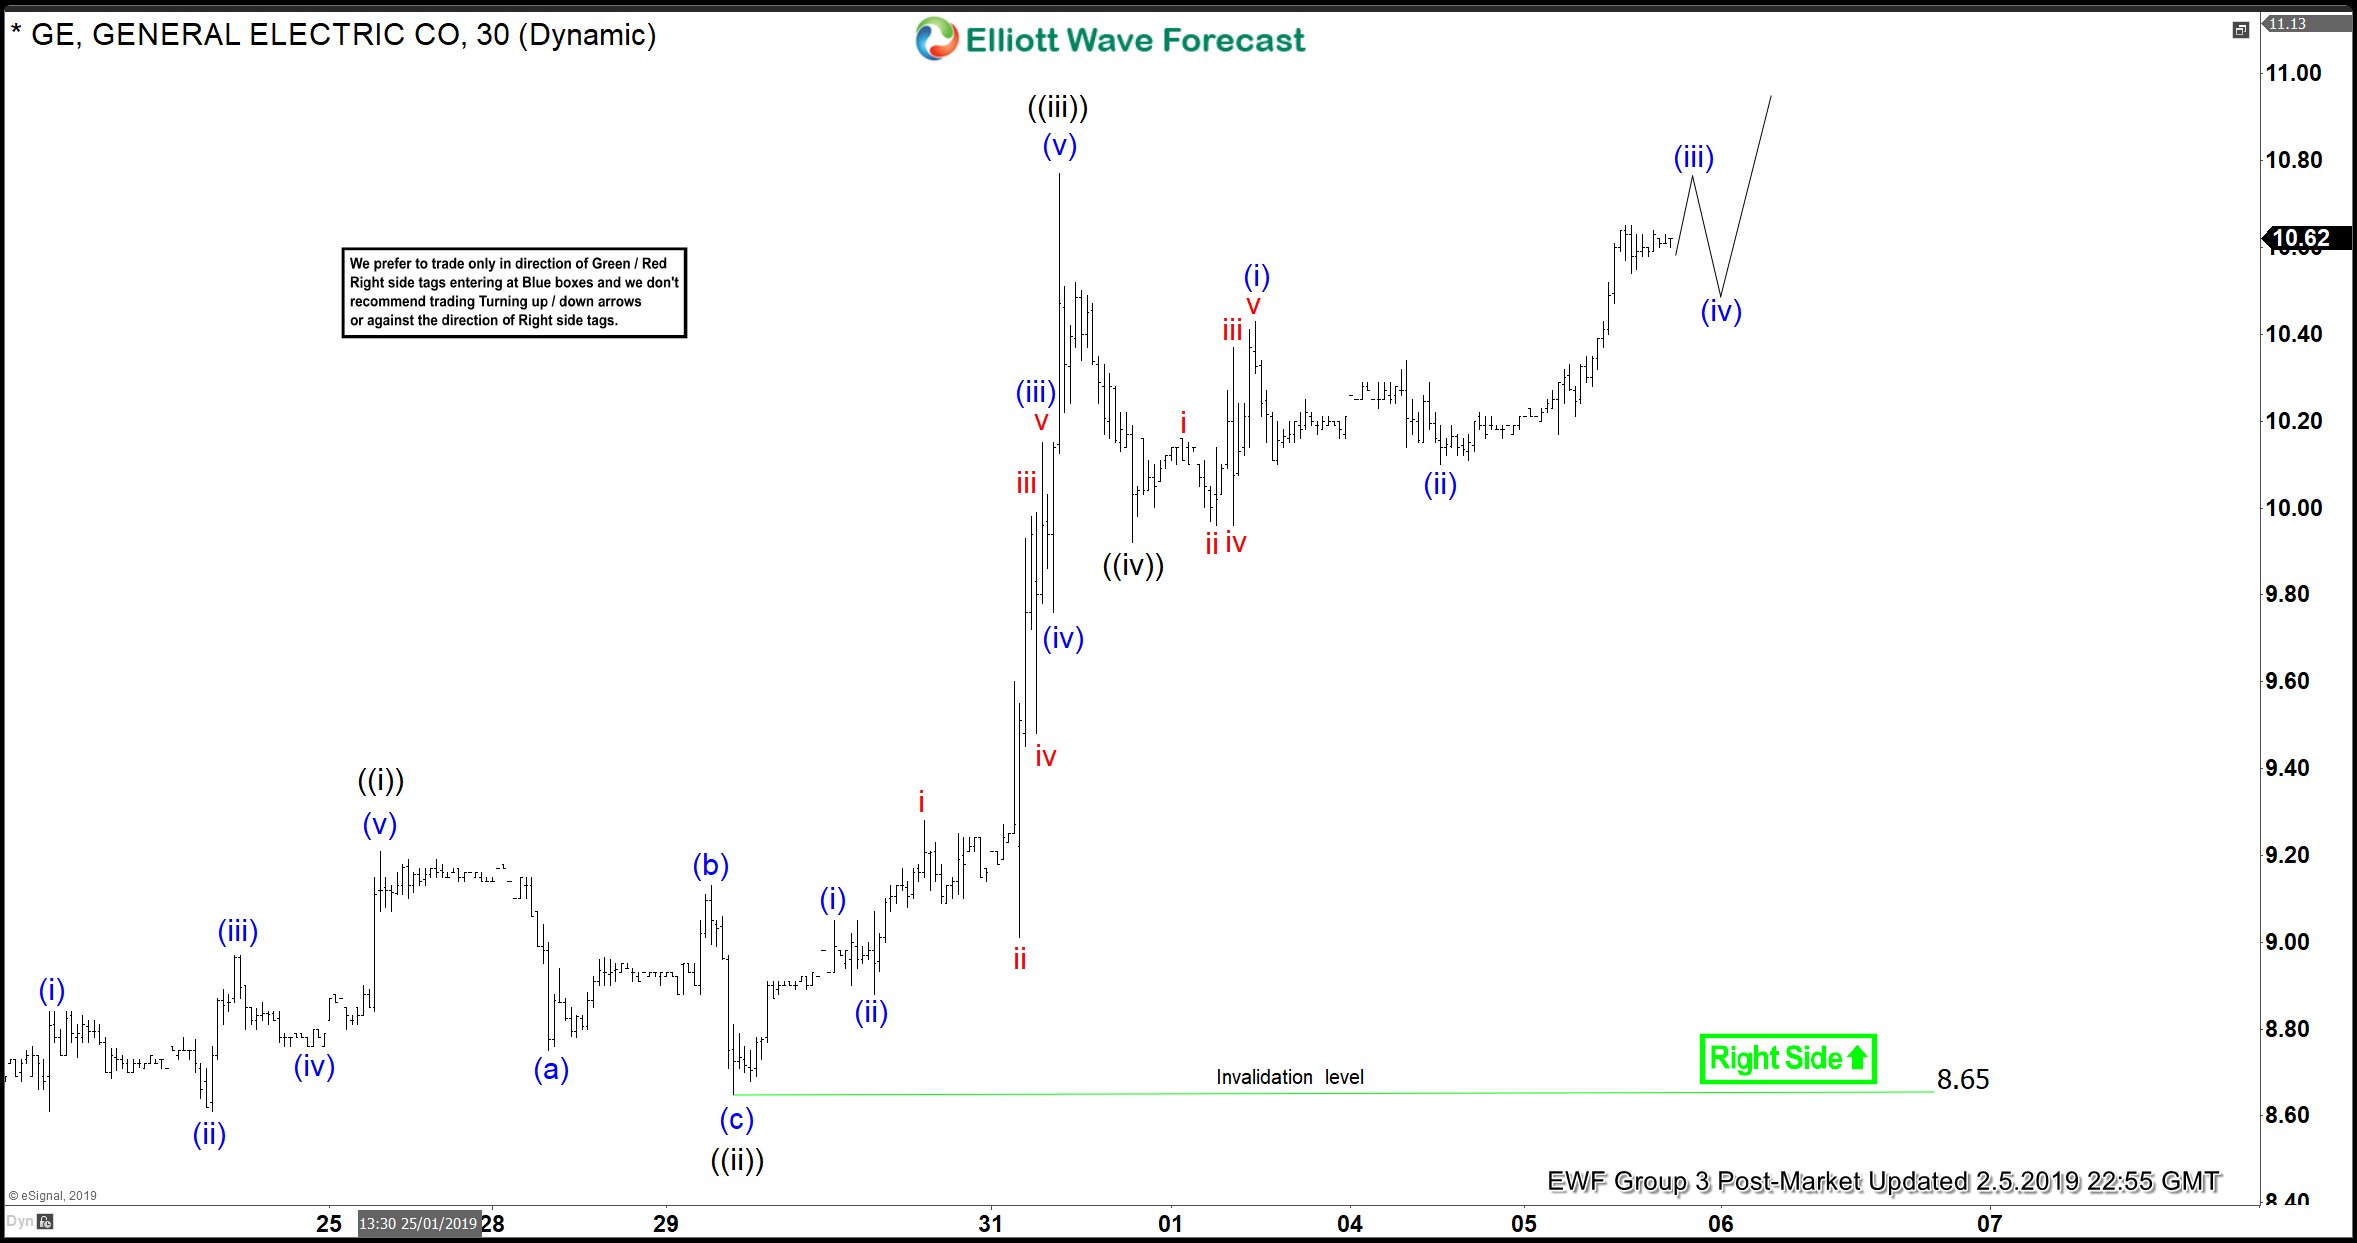
Elliott wave view in General Electric (ticker symbol: $GE) suggests that the rally from December 11.2018 low ($6.66) is unfolding as Elliott wave zigzag structure when the first leg of a bounce ended in lesser degree 5 waves structure in wave A at $9.25 high. Down from there, wave B ended 3 wave pullback at $8.56 low. Zigzag (5-3-5) is a combination of 3 waves corrective sequence labeled as A, B, C. The inner sub-division of wave A & wave C consists of 5 waves structure either as impulse or a diagonal. While wave B can be any 3 wave corrective sequence.
Up from $8.56 low, wave C is unfolding in another 5 waves structure where lesser degree wave ((i)) ended at $9.21 high. Wave ((ii)) pullback ended in lesser degree zigzag structure at $8.65 low. Wave ((iii)), also unfolded in lesser degree 5 waves & ended at $10.77 high. Below from there, wave ((iv)) pullback ended at $9.92 low. Wave ((v)) remain in progress in lesser degree 5 waves structure and should be looking to extend higher 1 more push towards $11.15-$12.76 100%-161.8% Fibonacci extension area of A-B before ending the wave C of a zigzag structure in a bigger wave (4). Afterwards, General Electric is expected to resume the downside or should do a 3 wave pullback at least. Near-term, as far as the pivot from $8.65 low stays intact expect stock to extend higher.
General Electric 1 Hour Elliott Wave Chart



Comments
Log in or sign up to join the conversation.