


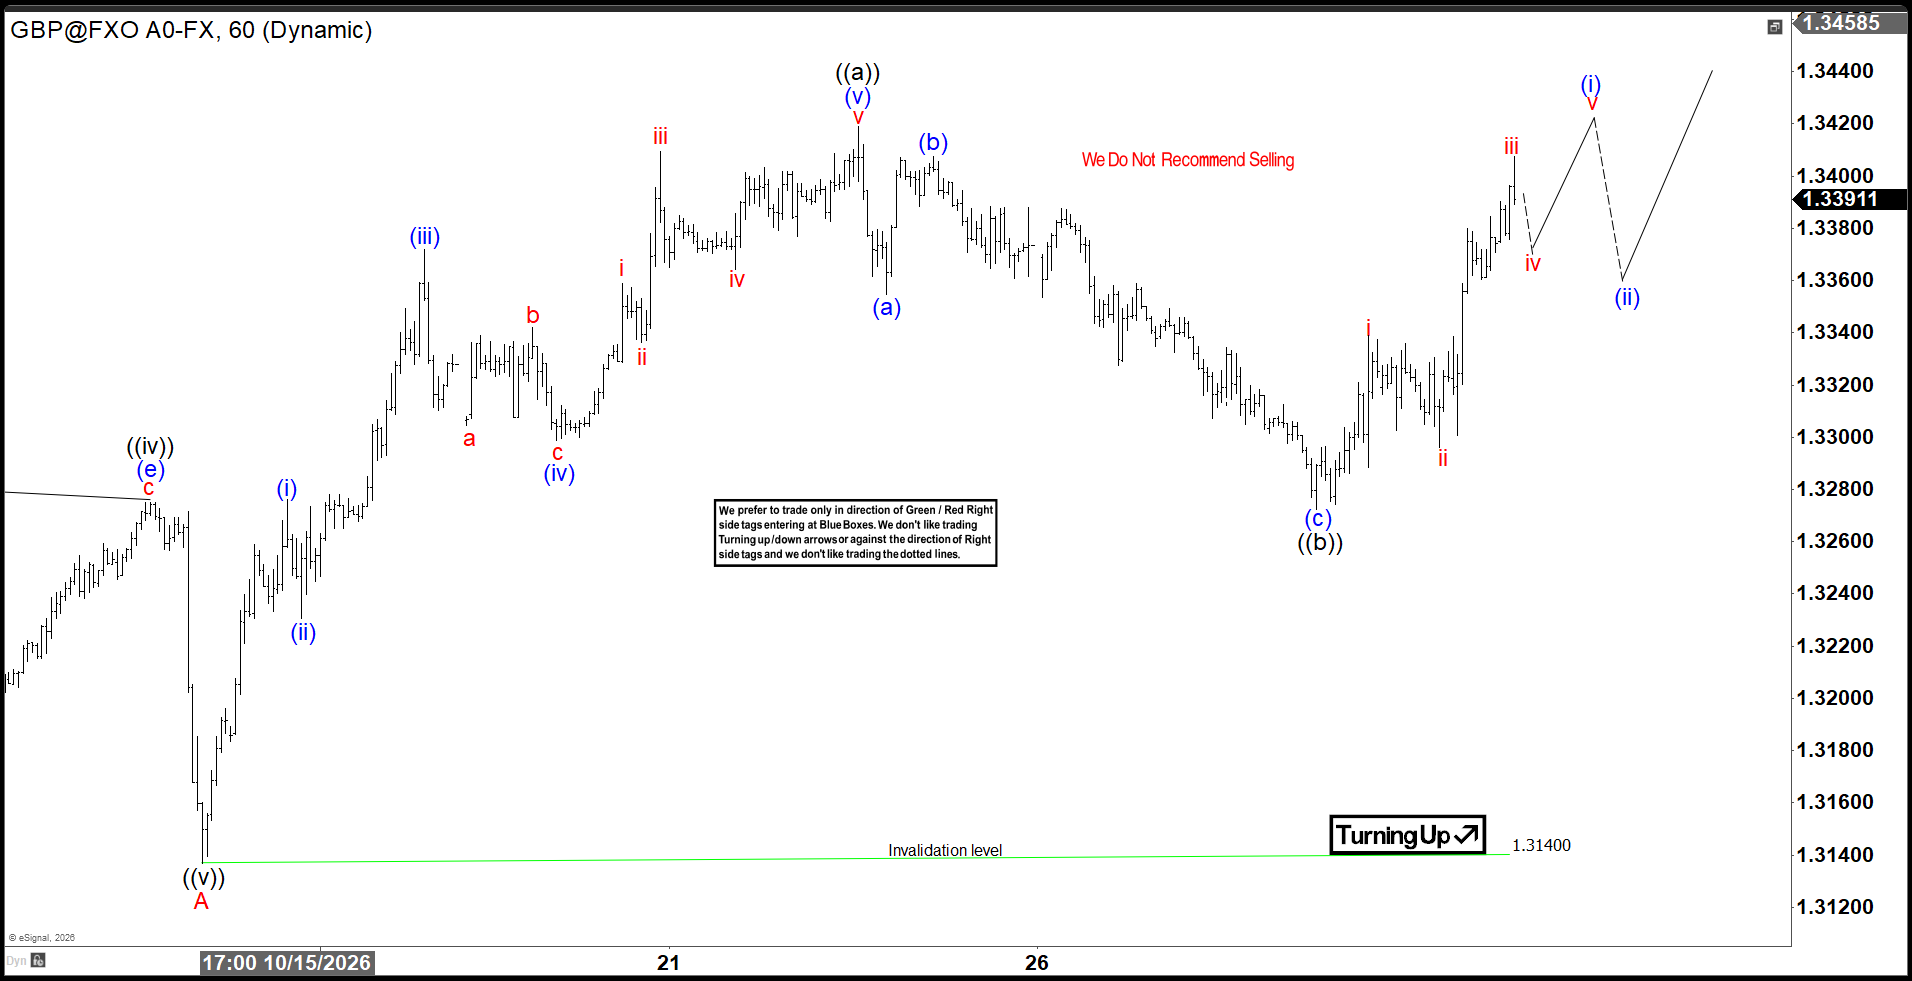
The short-term Elliott Wave outlook for GBPUSD suggests that the decline from the August 21 high is unfolding as a zigzag corrective structure. The initial leg lower, labeled wave A, completed at 1.314, as shown on the 1-hour chart. Following that low, the pair began a wave B recovery. This rally is expected to correct the decline from the August 21 peak before the broader bearish sequence resumes.
Wave B is taking shape as another zigzag pattern of a lesser degree. From the wave A low, wave (i) advanced to 1.3276 before a pullback in wave (ii) ended at 1.323. The pair then resumed higher in wave (iii), reaching 1.337. A subsequent correction in wave (iv) found support at 1.3298. From there, the final push higher in wave (v) extended to 1.3419, completing wave ((a)) of the larger-degree wave B correction.
After finishing wave ((a)), GBPUSD entered a pullback in wave ((b)), which unfolded as a zigzag structure. The decline from 1.3419 developed in three distinct swings. Wave (a) of ((b)) ended at 1.3354, followed by a corrective rebound in wave (b) that reached 1.3407. The final leg lower in wave (c) completed at 1.327, thereby ending wave ((b)) in the higher-degree structure.
The pair has since turned higher and appears to be developing the next advance within wave ((c)). A decisive break above the wave ((a)) high at 1.3419 would strengthen the bullish case and confirm that the next leg higher is already underway. Such a move would further support the view that wave B remains incomplete and still has room to extend.
In the near term, the technical outlook remains constructive while the 1.314 pivot low stays intact. As long as this level continues to provide support, buyers should retain control of price action. Consequently, GBPUSD is expected to extend higher in a three-wave zigzag rally before completing the larger corrective cycle and eventually resuming the broader decline.
GBPUSD 60 Minute Elliott Wave Chart



Comments
Log in or sign up to join the conversation.