

Zoom Video Communications Inc., Elliott Wave Technical Analysis

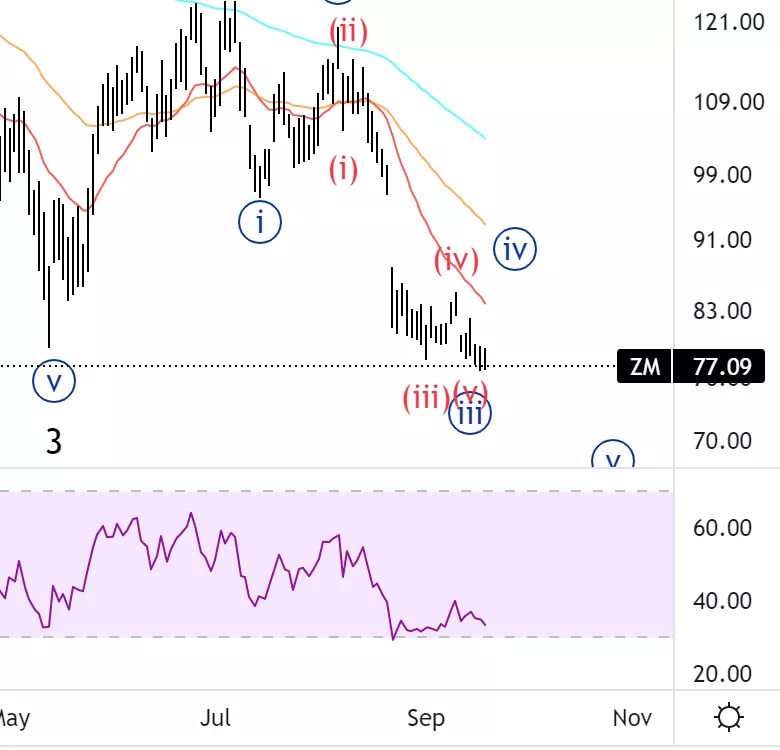
Zoom Video Communications Inc.,(ZM): Daily Chart, September 21 2022,
ZM Stock Market Analysis:I am looking for a pullback to come soon, as you can see we are forming RSI divergence.
ZM Elliott Wave count: {iii} of 5
ZM Trading Strategy: Looking for a bounce in wave {iv} to then place shorts
ZM Technical Indicators: The RSI is forming bullish divergence and we could most likely find resistance on the touch of the moving averages.
TradingLounge Analyst: Alessio Barretta
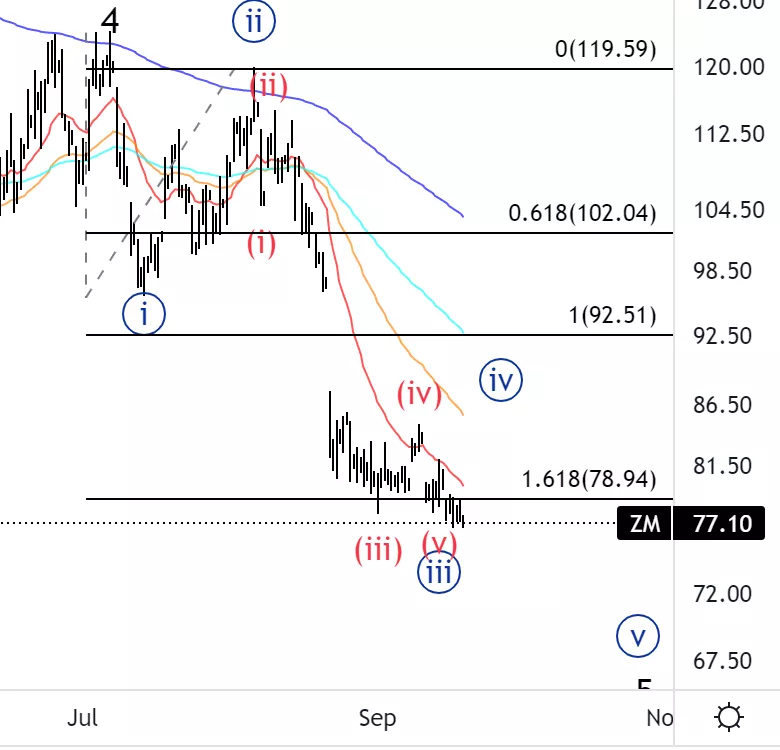
Zoom Video Communications Inc., ZM: 4-hour Chart, September 21 2022
Zoom Video Communications Inc., Elliott Wave Technical Analysis
ZM Stock Market Analysis: Wave {iii} has reached 1.618 {iii} vs {i} which could be the reason why we are starting to get resistance.
ZM Elliott Wave count: (v) of {iii}.
ZM Technical Indicators: We are below all averages. ZM Trading Strategy: For day trading you could even look at a pullback higher and buy the move
higher once the trend has clearly shifted.
More By This Author:
Commodity Markets: Gold Silver Forex Uranium Lithium Nickel Crude Oil Copper Natural Gas Elliott Wave
US Stocks Technical Analysis - Wednesday, Sept. 21
Elliott Wave Technical Analysis: Dogecoin, Sept. 20



Comments
Log in or sign up to join the conversation.