

WTI Crudeoil Elliott Wave Analysis
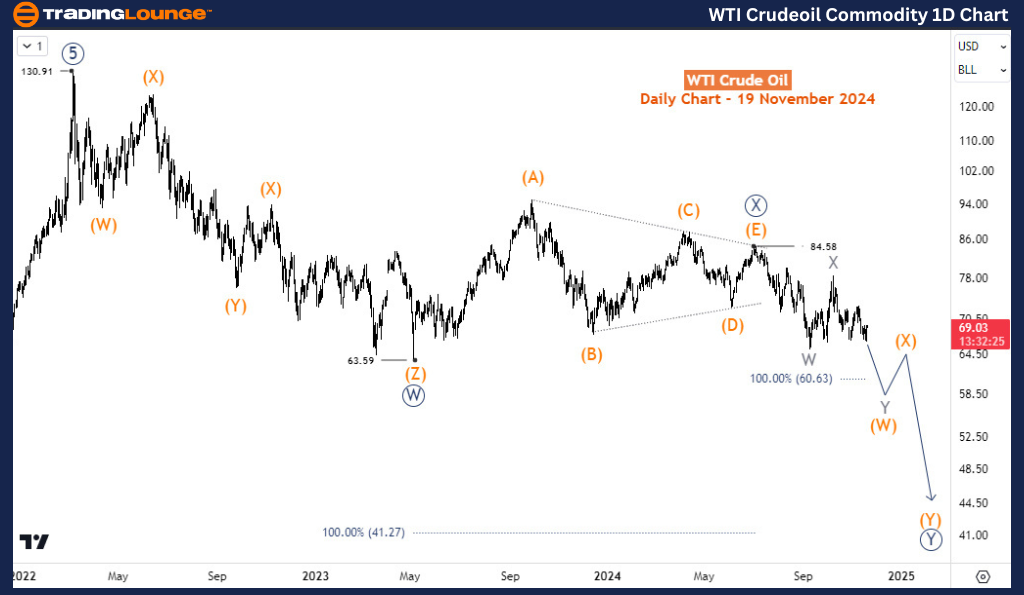
WTI is still under pressure after being resisted returning to the 80s in October. Thus, the commodity has recorded a net loss in the last four weeks, adding to the sell-off from March 2022, when it was traded for close to $131. From a technical standpoint, the downside risk is still strong, and traders may see the commodity plummet to $60 in the coming weeks or days.
On the daily chart, the sell-off from $130.91 is corrective and unfolding into a double zigzag structure. from the big picture, the commodity is correcting the impulse rally starting from the Covid low in April 2020 to March 2022 when it reached a $130.91 peak.
Wave ((W)) finished at 63.5 in May 2023 then followed by a triangle structure for wave ((X)) which finished at 85.5 in July 2024. From July, wave ((Y)) has evolved. Based on the previous and current price action, we will anticipate a double or triple zigzag structure for wave ((Y)) which could extend to $41 in the coming months. However, $60.6 is the next target where we expect wave (W) of ((Y)) to finish before another bounce for (X).
On the H4 chart price is unfolding as a flat structure for wave (b) of ((y)) of Y. While the current bounce is capped below the November highs, further decline could ensue toward $60.6 in the short term.
.png.a687050b0b0be83f07d2e9cd671ef01f.png)
Technical Analyst : Sanmi Adeagbo
More By This Author:
Unlocking ASX Trading Success: Rea Group Ltd - Tuesday, Nov. 19
Elliott Wave Technical Analysis: Shanghai Composite Index - Tuesday, Nov. 19
Elliott Wave Technical Analysis: Euro/British Pound Forex For Tuesday, Nov 19



Comments
Log in or sign up to join the conversation.