


Photo by regularguy.eth on Unsplash
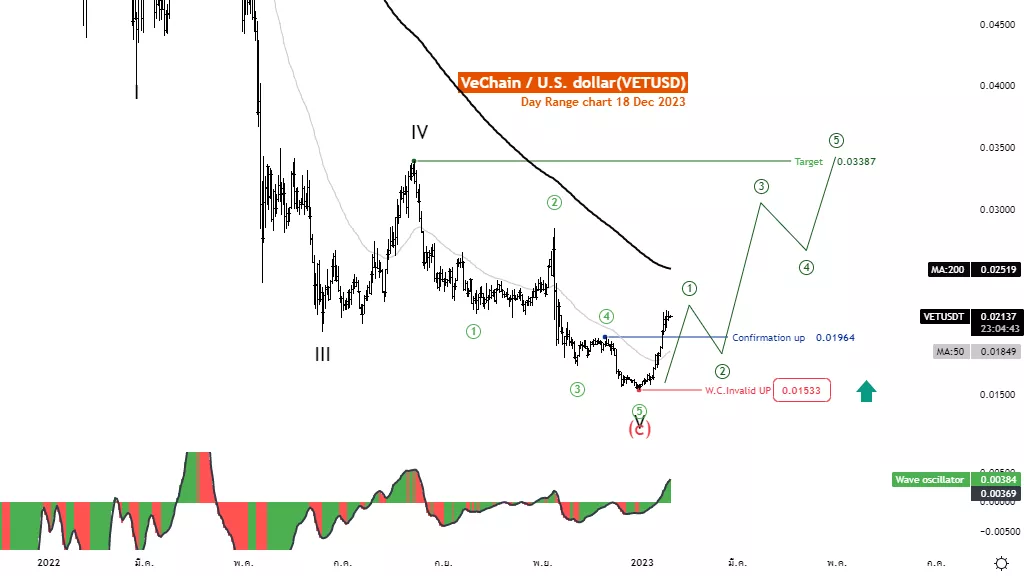
Elliott Wave Analysis TradingLounge Daily Chart, 18 January 23,
VeChain / U.S.Dollar(VETUSD)
VETUSD Elliott Wave Technical Analysis
Function: Follow trend
Mode: Motive
Structure: Impulse
Position: Wave V
Direction Next higher Degrees: wave V of Impulse
Details: Wave V may have caught and the price is reversing to an uptrend.
Wave Cancel invalid Level: 0.0153
VeChain / U.S.Dollar (VETUSD) Trading Strategy: VeChain token has recovered well from the 0.015 level, but even so, the price is still below MA200, so it is possible that the price is still in a downtrend. The increase may be the first period to change to an upward trend, so there is a throwback opportunity. Trading during this period must be done carefully.
VeChain / U.S.Dollar (VETUSD) Technical Indicators: The price is below the MA200 indicating a downtrend. The wave oscillators above Zero-Line momentum are bullish.
Analyst: Kittiampon Somboonsod
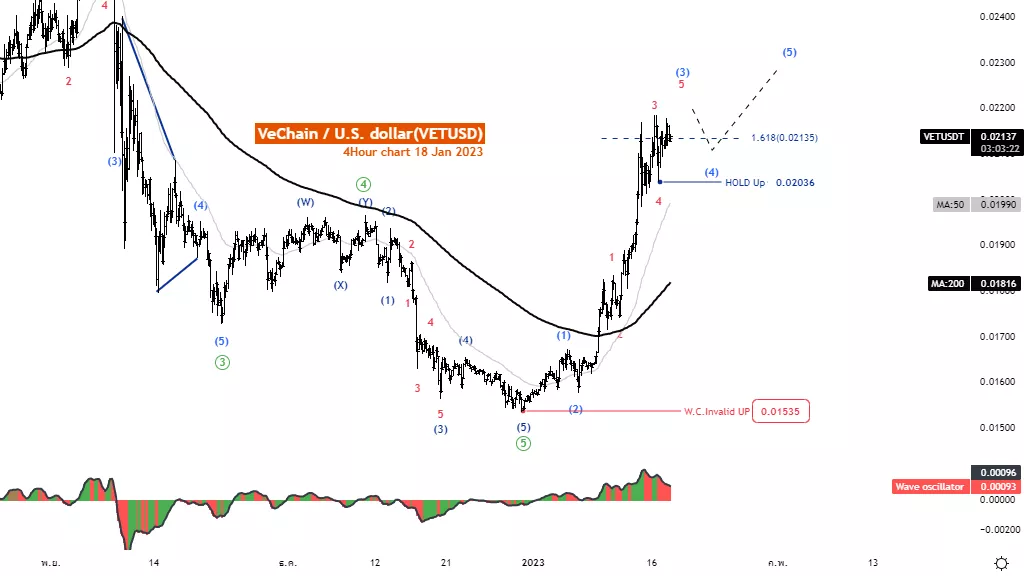
Elliott Wave Analysis TradingLounge 4H Chart, 18 January 23,
VeChain / U.S.Dollar (VETUSD)
VETUSD Elliott Wave Technical Analysis
Function: Follow trend
Mode: Motive
Structure: Impulse
Position: Wave 3
Direction Next higher Degrees: wave (1) of Motive
Details: Wave 3 rise is likely towards the level of 0.02135
Wave Cancel invalid Level: 0.01535
VeChain / U.S.Dollar (VETUSD) Trading Strategy: VeChain coin has recovered well from the level of 0.015 and can pass MA200, MA50, the price is clearly uptrend. But even so, the price is at the end of the rally at the end of the wave (5). In the short term, the price will reverse again. Trading during this period must be done carefully.
VeChain / U.S.Dollar (VETUSD) Technical Indicators: The price is above the MA200 MA50, indicating an uptrend. The wave oscillators above Zero-Line momentum are bullish.
More By This Author:
Australian Stock Market Report - ASX200 Banks Resources Forex
Elliott Wave Technical Analysis: Binance / U.S. Dollar
Elliott Wave Technical Analysis: S&P 500 Index And Market Overview - Tuesday, Jan. 17



Comments
Log in or sign up to join the conversation.