

Photo by Austin Distel on Unsplash
Twist Bioscience Corp., Elliott Wave Technical Analysis
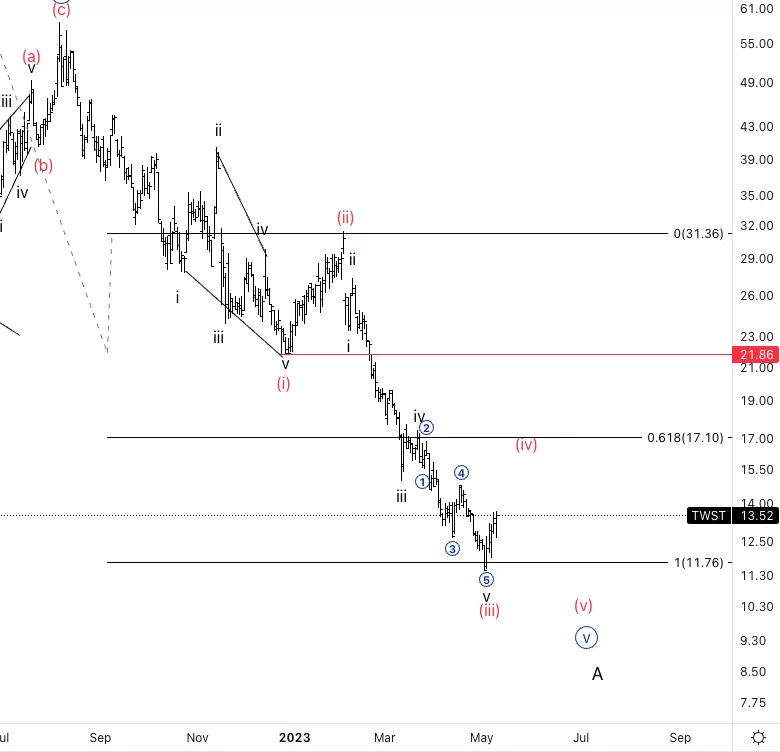
Twist Bioscience Corp., (Nasdaq: TWST): Daily Chart, 10 May 2023.
TWST Stock Market Analysis: The stock has been moving as forecasted for several weeks. At this point, it looks like we are looking at a larger retracement to start taking place.
TWST Elliott Wave Count: Wave (iv) of {v}.
TWST Technical Indicators: Below all averages.
TWST Trading Strategy: Looking for shorts once we have signs wave (iv) is complete.
Analyst: Alessio Barretta
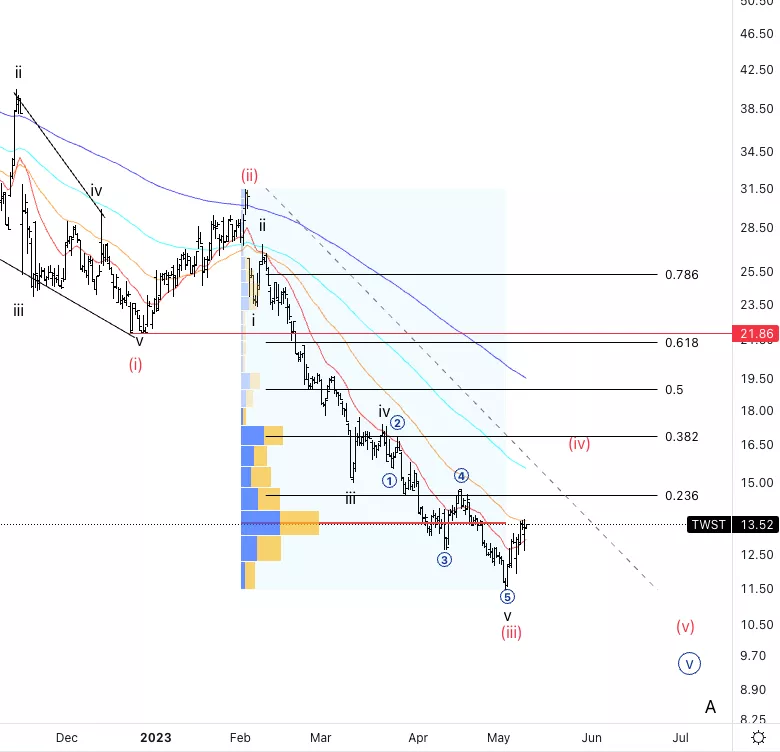
Twist Bioscience Corp., TWST: 1-hour Chart, 10 May 2023.
Twist Bioscience Corp., Elliott Wave Technical Analysis
TWST Stock Market Analysis: Looking for upside to start escalate as we move higher into wave (iv). Looking for wave (iv)to reach either 23.6% or 38.2% of the advance in wave (iii) as we also as larger volume around those areas.
TWST Elliott Wave count: Wave a of (iv).
TWST Technical Indicators: Above a20EMA.
TWST Trading Strategy: Looking for shorts once we have signs wave (iv) is complete.
More By This Author:
Elliott Wave Technical Analysis: Theta Token/U.S. Dollar - Wednesday, May 10
SP500, Nasdaq, Russell 2000, Dow Jones: Elliott Wave Trading Strategies
Elliott Wave Technical Analysis: Binance/U.S. Dollar - Tuesday, May 9


Comments
Log in or sign up to join the conversation.