


Twist Biosciences Corp., Elliott Wave Technical Analysis
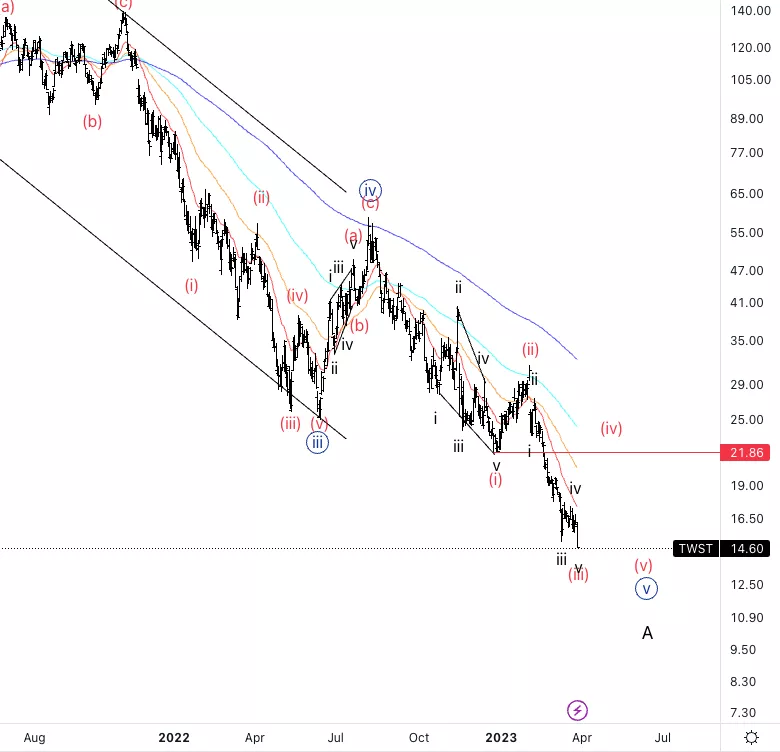
Twist Biosciences Corp., (Nasdaq: TWST): Daily Chart, 29 March 2023.
TWST Stock Market Analysis: Twist has been moving as expected, so we could definitely be in wave v of (iii) as we are looking for further downside.
TWST Elliott Wave Count: Wave (iii) of {v}.
TWST Technical Indicators: Below all averages.
TWST Trading Strategy: Looking for downside into wave (iii) to then continue lower to complete {v}.
Analyst: Alessio Barretta
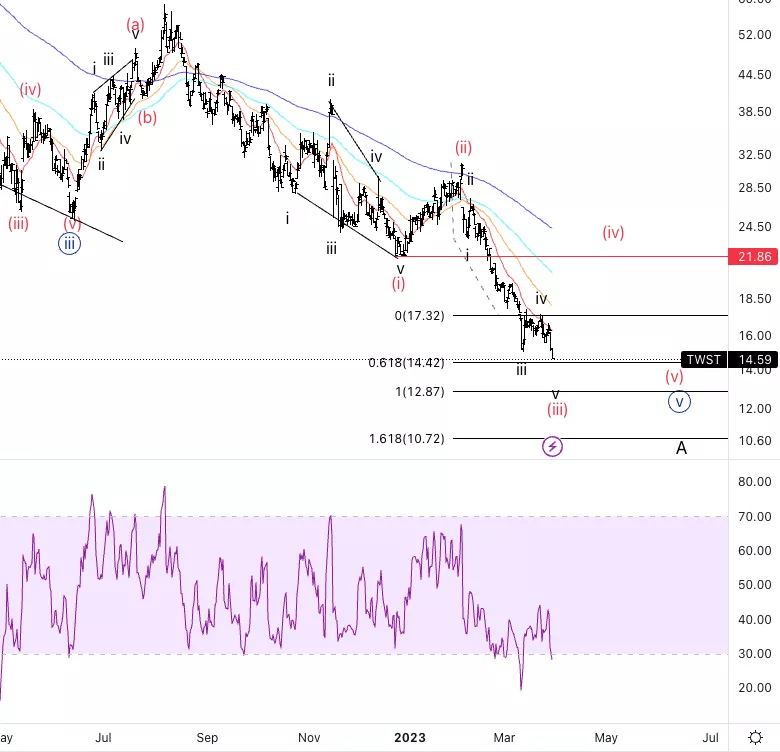
Twist Biosciences Corp., TWST: 4-hour Chart, 29 March 2023.
Twist Biosciences Corp., Elliott Wave Technical Analysis
TWST Stock Market Analysis: We are looking at a potential zone of support for wave v and that could be represented by equality of v vs. i at 12.87$.
TWST Elliott Wave count: Wave v of (iii).
TWST Technical Indicators: Below all averages, with weak signs of RSI bullish divergence.
TWST Trading Strategy: Looking for quick short trades into wave v.
More By This Author:
Elliott Wave Technical Analysis: Cardano/U.S. Dollar
Elliott Wave Analysis: Commodities Market
Elliott Wave Analysis: DAX 40 - FTSE 100 - DXY - GBPUSD - EURUSD



Comments
Log in or sign up to join the conversation.