

Image Source: Unsplash
The Trader Desk Inc., Elliott Wave Technical Analysis
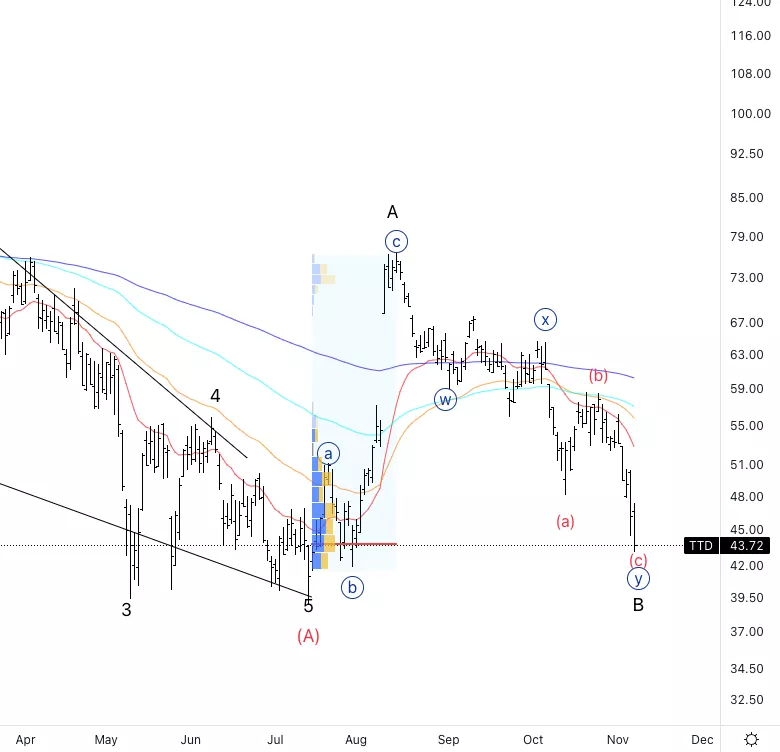
The Trader Desk Inc., (Nasdaq: TTD): Daily Chart, November 8, 2022,
TTD Stock Market Analysis: Looking for the move in wave B of (B) to come to an end soon then take advantage of the upside in wave C.
TTD Elliott Wave Count: Wave {y} of B.
TTD Technical Indicators: We are below all EMAs. We have reached the point of control dictated by volume.
TTD Trading Strategy: Looking for further confirmation before considering longs.
Analyst: Alessio Barretta
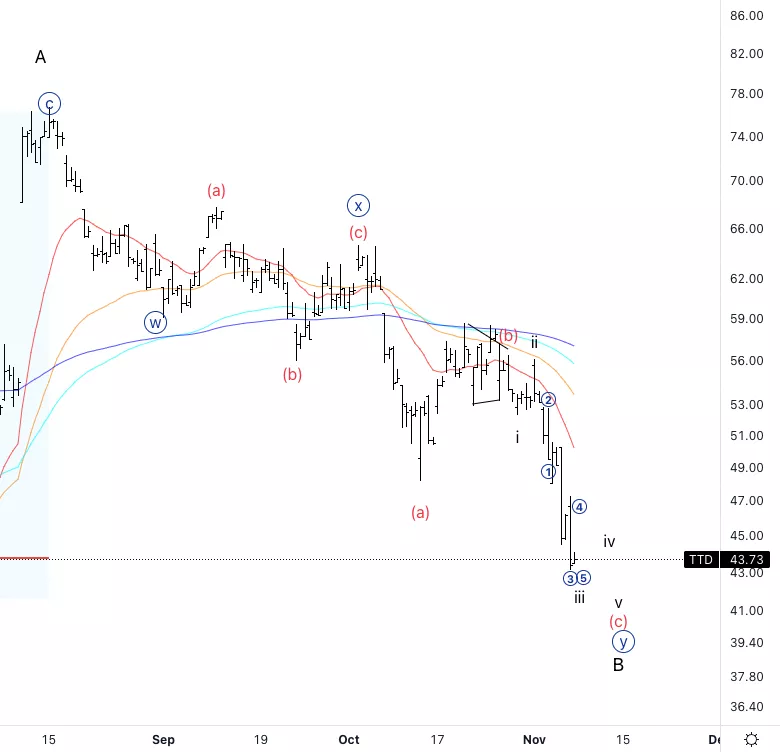
The Trader Desk Inc., TTD: 4-hour Chart, November 8, 2022
The Trader Desk Inc., Elliott Wave Technical Analysis
TTD Stock Market Analysis: It looks like we down move is not completed yet as we do not have a clear five-wave sequence established.
TTD Elliott Wave count: Wave 5 of iii.
TTD Technical Indicators: Below is all EMAs.
TTD Trading Strategy: You may look for very short-term shorts as we should start getting a series of wave fours.
More By This Author:
Elliott Wave Technical Analysis: Dogecoin, Tuesday, Nov. 8
Elliott Wave Technical Analysis: KLA Corp., Monday, Nov. 7
Elliott Wave Technical Analysis: Ethereum, Monday, Nov. 7


Comments
Log in or sign up to join the conversation.