

Texas Instruments Inc., Elliott Wave Technical Analysis

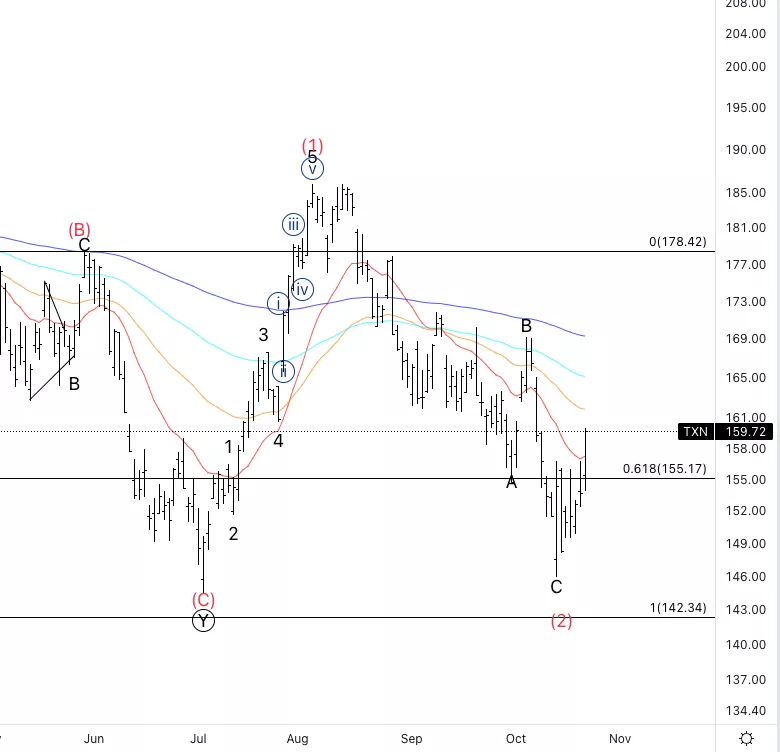
Texas Instruments Inc., (TXN): Daily Chart, October 24 2022,
TXN Stock Market Analysis: Looking for a potential end to wave (2) as we could start to resumet he overall uptrend.
TXN Elliott Wave count: Wave 1 of (3).
TXN Technical Indicators: We just broke through the 20EMA.
TXN Trading Strategy: Looking for further confirmation before considering long term positions as there is still no clear evidence the uptrend has resumed.
TradingLounge Analyst: Alessio Barretta
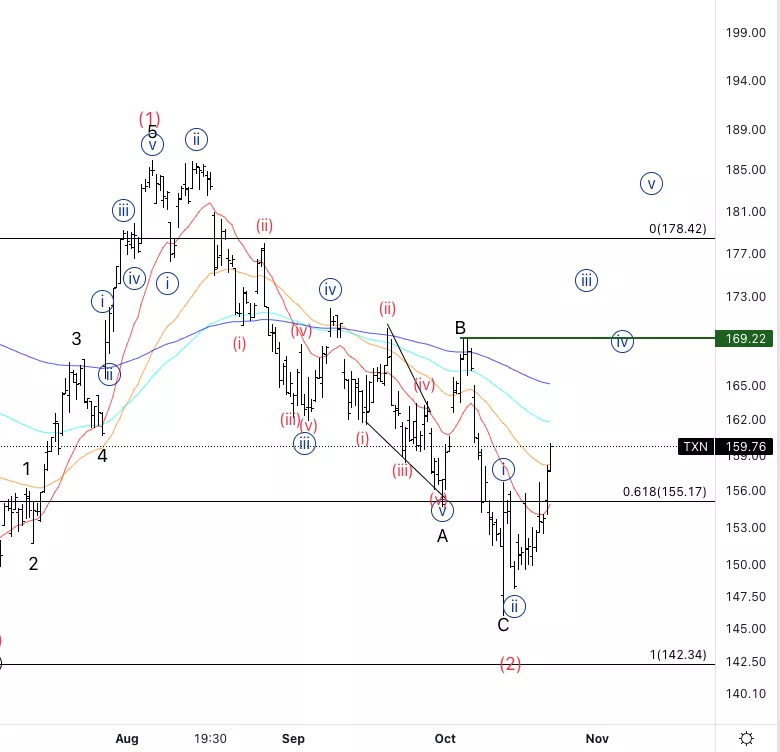
Texas Instruments Inc., TXN: 4-hour Chart, October 24 2022
Texas Instruments Inc., Elliott Wave Technical Analysis
TXN Stock Market Analysis: Looking for an acceleration to the upside as it stands. Otherwise we will most likely fall back and break the previous wave (1) origin.
TXN Elliott Wave count: Wave {i} of 1.
TXN Technical Indicators: Trying to break through the EMAs.
TXN Trading Strategy: Looking for short term trades to the upside on three wave pullbacks.
More By This Author:
Elliott Wave Technical Analysis: Gold, Silver, Forex, Uranium, Lithium, Nickel, Crude Oil, Copper, Natural Gas
SP500 Elliott Wave Iii) Of C Of (2) - Monday, Oct. 24
Stock Market Summary SP500 & US Stocks Elliott Wave Count



Comments
Log in or sign up to join the conversation.