

Image Source: Pixabay
Texas Instruments Inc., Elliott Wave Technical Analysis
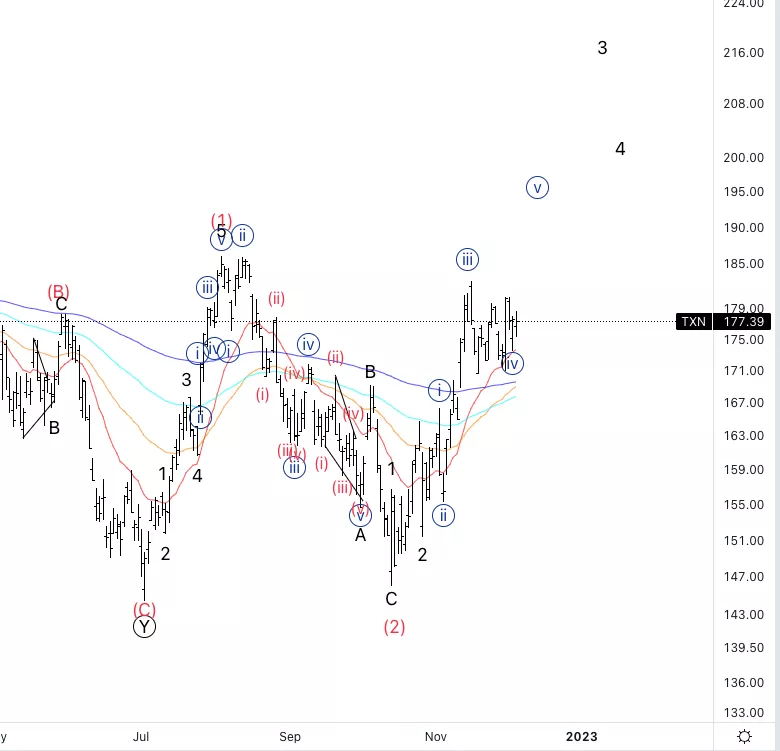
Texas Instruments Inc., (Nasdaq: TXN): Daily Chart, December 6, 2022,
TXN Stock Market Analysis: It looks like we are into wave (3) and we are looking to extend higher. We have consolidated above all averages and it looks like we are ready to resume higher.
TXN Elliott Wave Count: Wave {iv} of 3.
TXN Technical Indicators: Above all EMAs.
TXN Trading Strategy: Looking for longs into wave {v} which you can already start to build.
Analyst: Alessio Barretta
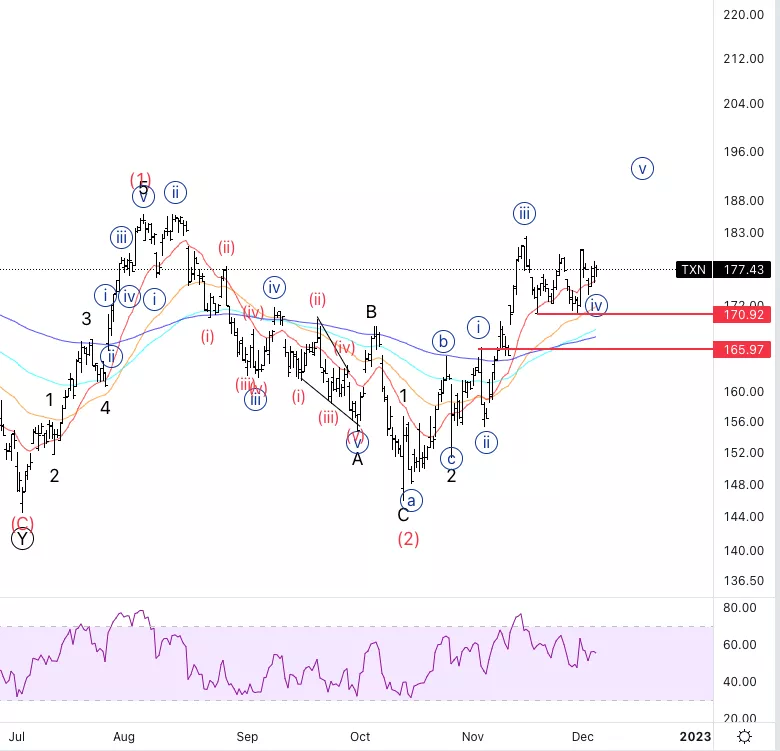
Texas Instruments Inc., TXN: 4-hour Chart, December 6, 2022
Texas Instruments Inc., Elliott Wave Technical Analysis
TXN Stock Market Analysis: Looking for further upside as we have a nice alternation between a sharp wave {ii} and a sideways/potential triangle wave {iv}.
TXN Elliott Wave count: Wave {iv} of 3.
TXN Technical Indicators: 20EMA currently acting as support.
TXN Trading Strategy: Looking for longs with an aggressive stop at $171 and a more conservative stop at $166.
More By This Author:
Elliott Wave Technical Analysis: Neo/US Dollar, Tuesday, Dec. 6
Elliott Wave Technical Analysis: Analog Devices, Monday, Dec. 5
Elliott Wave Technical Analysis: Bitcoin, Monday, Dec. 5


Comments
Log in or sign up to join the conversation.