


Image Source: Unsplash
Texas Instruments Inc., Elliott Wave Technical Analysis
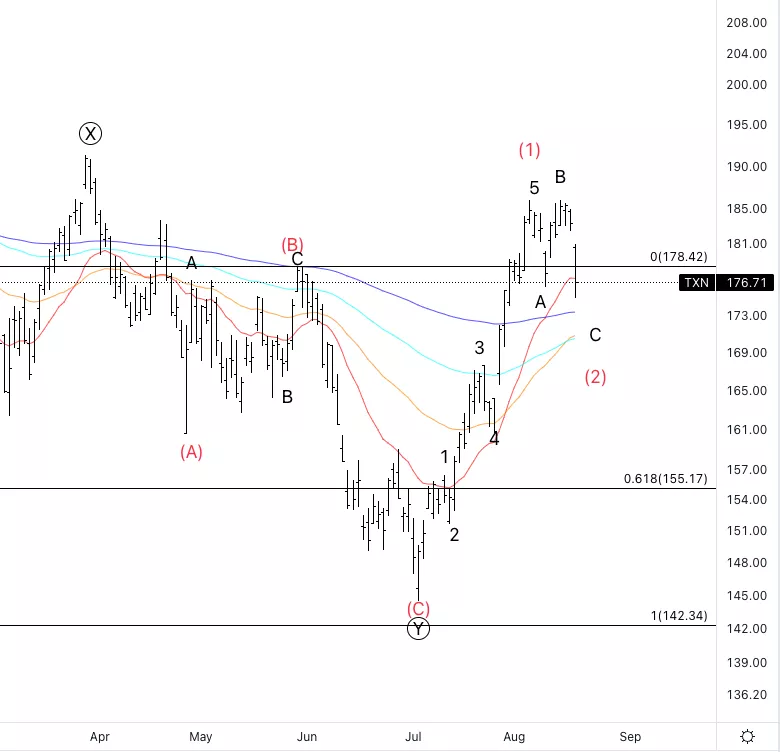
Texas Instruments Inc.,(Nasdaq: TXN): Daily Chart, August 18, 2022,
TXN Stock Market Analysis: Retracing as expected, we could have a simple and short wave (2) or else have a double correction lower.
TXN Elliott Wave count: C of (2)
TXN Trading Strategy: Wait for the end of wave C and then look for a bounce to start building longs.
TXN Technical Indicators: We are above the 200EMa while we are crossing the 20 EMA. I would like to see the 200 EMA act as support.
Analyst: Alessio Barretta
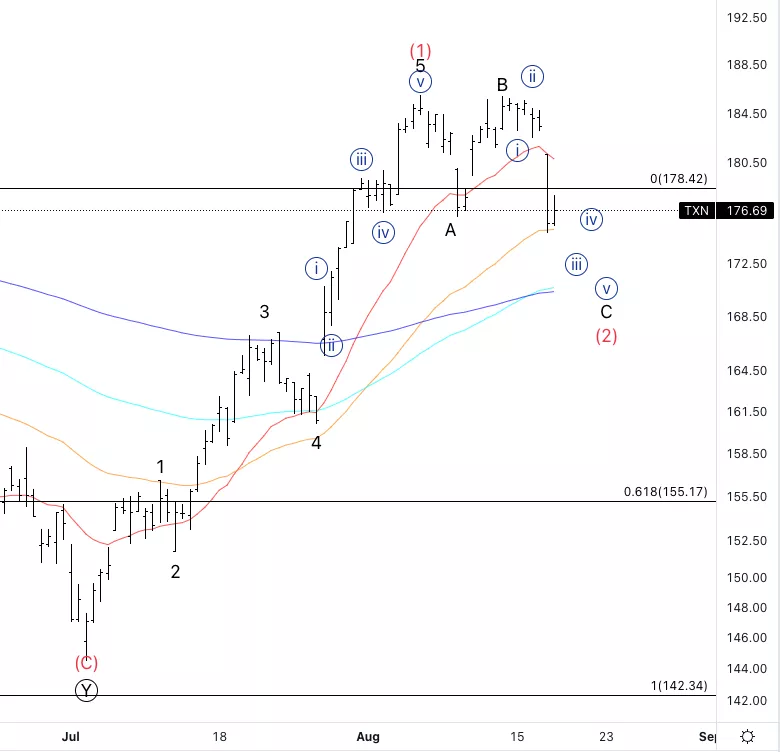
Texas Instruments Inc., TXN: 4-hour Chart, August 18, 2022,
Texas Instruments Inc., Elliott Wave Technical Analysis
TXN Stock Market Analysis: It looks like wave C is not yet completed and we could unfold lower.
TXN Elliott Wave count: Wave {iii} of C.
TXN Technical Indicators: Below the 20EMA, we could get support from the 200EMA.
TXN Trading Strategy: In a short time frame we could look for short opportunities.
More By This Author:
SP500 Elliott Wave Analysis: Wave (a) Of 4 - Short Trade Set-Ups
Commodity Markets: Gold, Silver, Iron Ore, Crude Oil, Copper, Natural Gas
Pepsico Inc. Elliott Wave Technical Analysis - August 17, 2022



Comments
Log in or sign up to join the conversation.