

Spotify Inc., Elliott Wave Technical Analysis

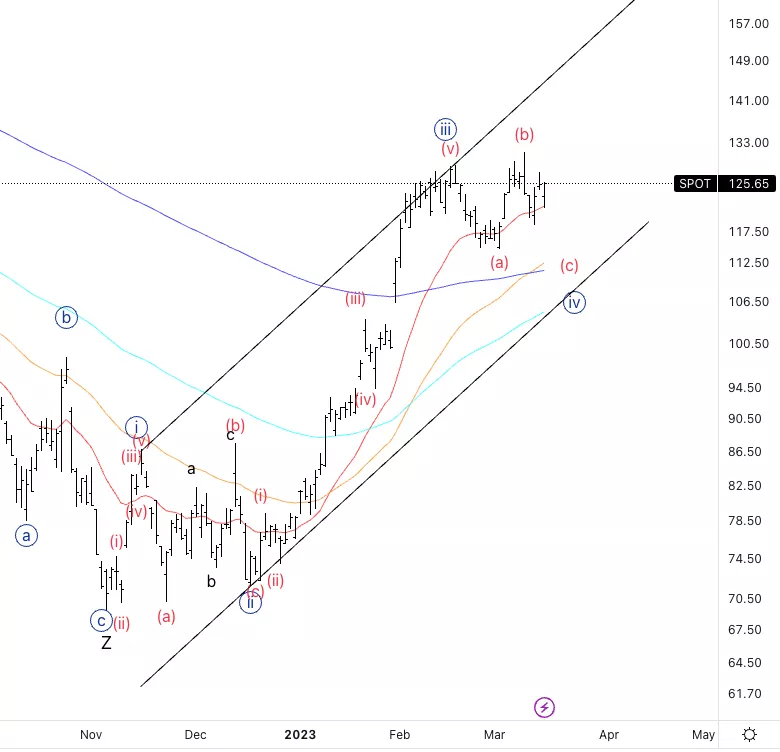
Spotify Inc., (SPOT): Daily Chart, Thursday, March 16.
SPOT Stock Market Analysis: Moving as expected, looking for further upside into wave {v}. We could be due another leg lower into wave (c) to then resume higher.
SPOT Elliott Wave Count: Wave (b) of {iv}.
SPOT Technical Indicators: Above all averages.
SPOT Trading Strategy: Waiting for a potential leg lower to then look for longs.
TradingLounge Analyst: Alessio Barretta
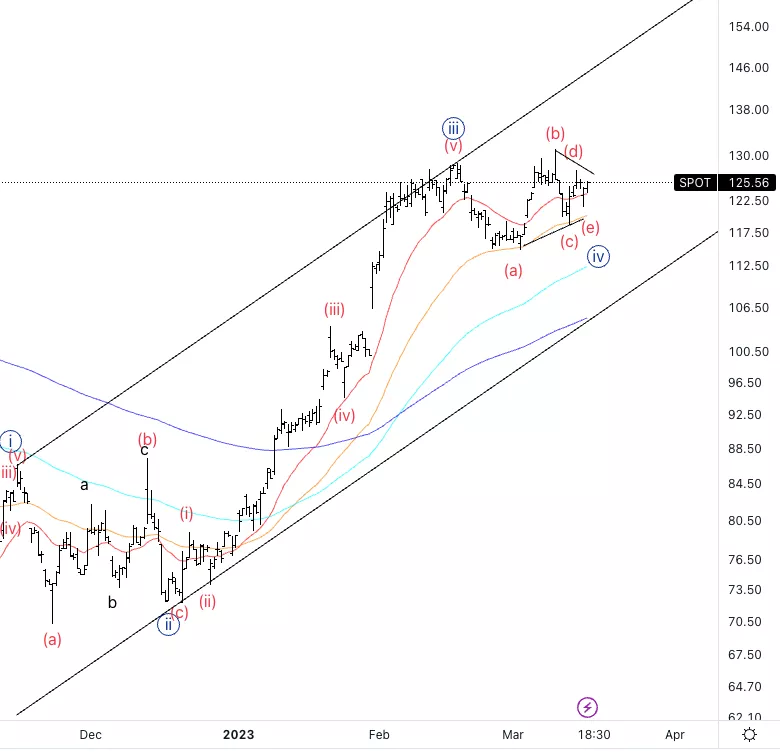
Spotify Inc., SPOT: 4-hour Chart, Thursday, March 16.
Spotify Inc., Elliott Wave Technical Analysis
SPOT Stock Market Analysis: Here an alternate to the other bullish count. A potential triangle in wave {iv} to immediately resume higher.
SPOT Elliott Wave count: Wave (e) of {iv}.
SPOT Technical Indicators: 20EMA as support.
SPOT Trading Strategy: Looking for a bottom in place, ready for upside.
More By This Author:
Elliott Wave Technical Analysis: Theta Coin
U.S. Indices: Elliott Wave Trading Strategies
Elliott Wave Technical Analysis: Phreesia Inc. - Wednesday, March 15



Comments
Log in or sign up to join the conversation.