

Image Source: Pixabay
Spotify Inc., Elliott Wave Technical Analysis
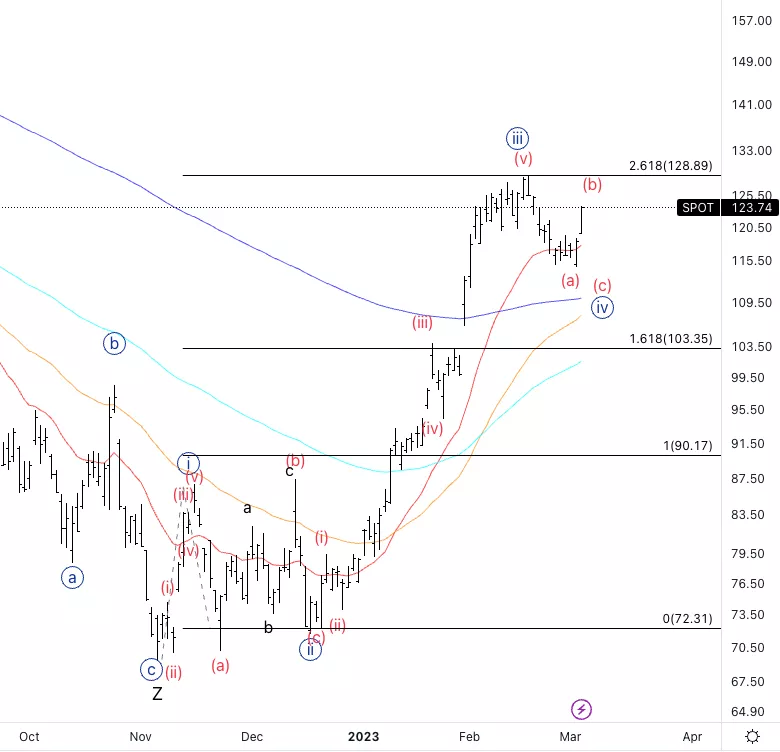
Spotify Inc., (Nasdaq: SPOT): Daily Chart, 6 March 2023.
SPOT Stock Market Analysis: It looks like we bottomed in wave (a) after a top in wave {iii} being 1.618 {iii} vs. {i}. Looking for another leg down into wave (c) before considering longs.
SPOT Elliott Wave Count: Wave (a) of {iv}.
SPOT Technical Indicators: 20EMA as support.
SPOT Trading Strategy: Looking for one leg lower in wave (c) before considering longs.
Analyst: Alessio Barretta
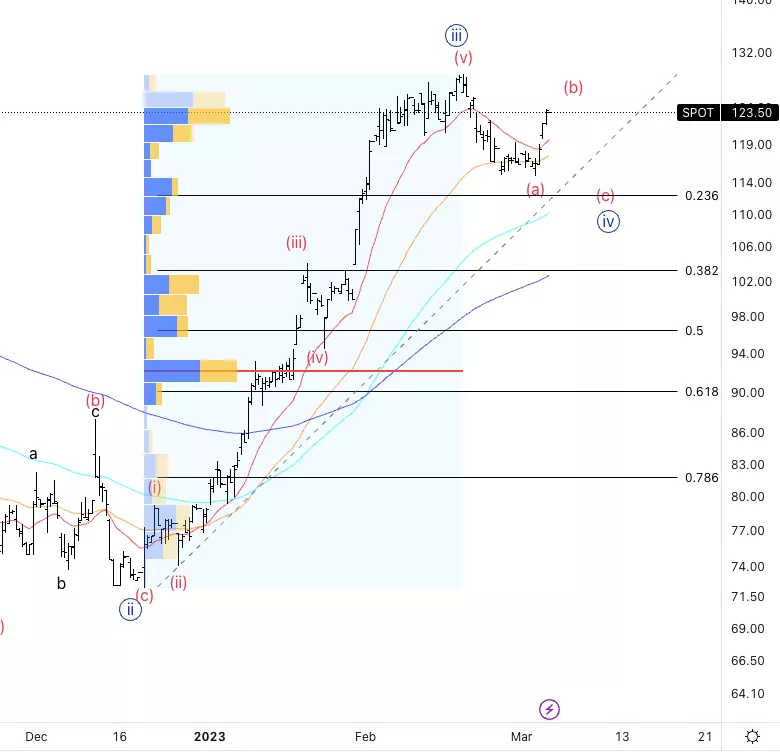
Spotify Inc., SPOT: 4-hour Chart, 6 March 2023.
Spotify Inc., Elliott Wave Technical Analysis
SPOT Stock Market Analysis: It was a sharp move down into wave (a) which is very common for wave As. We didn’t even reach the 0.236 retracement of wave {iii} which is why I favor further downside before upside resumption.
SPOT Elliott Wave count: Wave (a) of {iv}.
SPOT Technical Indicators: In between averages
SPOT Trading Strategy: Looking for further downside in wave (c).
More By This Author:
Elliott Wave Technical Analysis: Phreesia Inc.
Elliott Wave Technical Analysis: Cardano / U.S. Dollar
Major Stock Indices Elliott Wave Trading Strategies


Comments
Log in or sign up to join the conversation.