

Soybean Elliott Wave Analysis
Soybean is poised to continue the year-long bearish trend. Thus, sellers will attempt to breach the August 2024 low in the coming weeks. However, while the price remains above the October 2024 low, traders shouldn’t write off further rallies above the October highs.
Long-term and Daily Chart Analysis
Taking a look at the larger picture, the current bearish cycle started at 1787 in June 2022. It’a also noteworthy that the over 28-month decline is only correcting prior bullish impulse rallies between May 2019 and June 2022.
The daily chart shows the extent the correction has evolved from the Elliott wave perspective. Price completed wave ((A)) with a diagonal in October 2023 and a shallow bounce for wave ((B)) which finished in November 2023. Wave ((C)) is unfolding as an impulse wave structure and is currently in the last leg which is wave (5) of ((C)).
.png.a46bf2433b8922278237e24daf5ea8e2.png)
H4 Chart Analysis
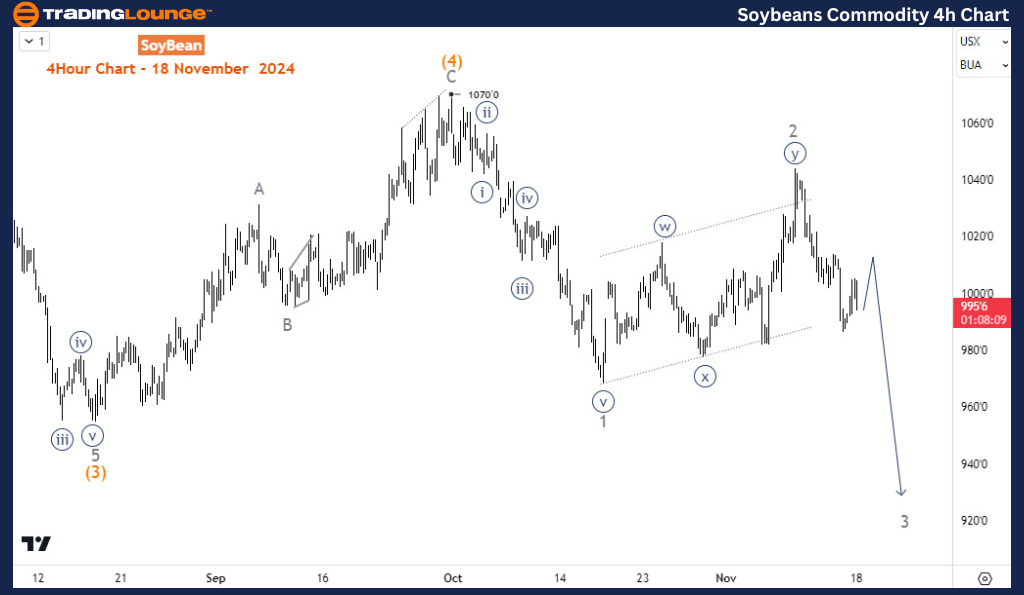
The H4 chart shows the emergence of wave (5). Price is currently in wave 3 of (5) and projected to reach $800-900 before the bounce for wave 4 follows. Thus, soybean still favors the downside to continue in as much as it stays below 1070.
Technical Analyst : Sanmi Adeagbo
More By This Author:
Unlocking ASX Trading Success: Telstra Group Limited
Elliott Wave Technical Analysis - JPMorgan & Chase Co.
Elliott Wave Technical Analysis: Dow Jones - Monday, Nov. 18



Comments
Log in or sign up to join the conversation.