
Shopify Inc., Elliott Wave Technical Analysis

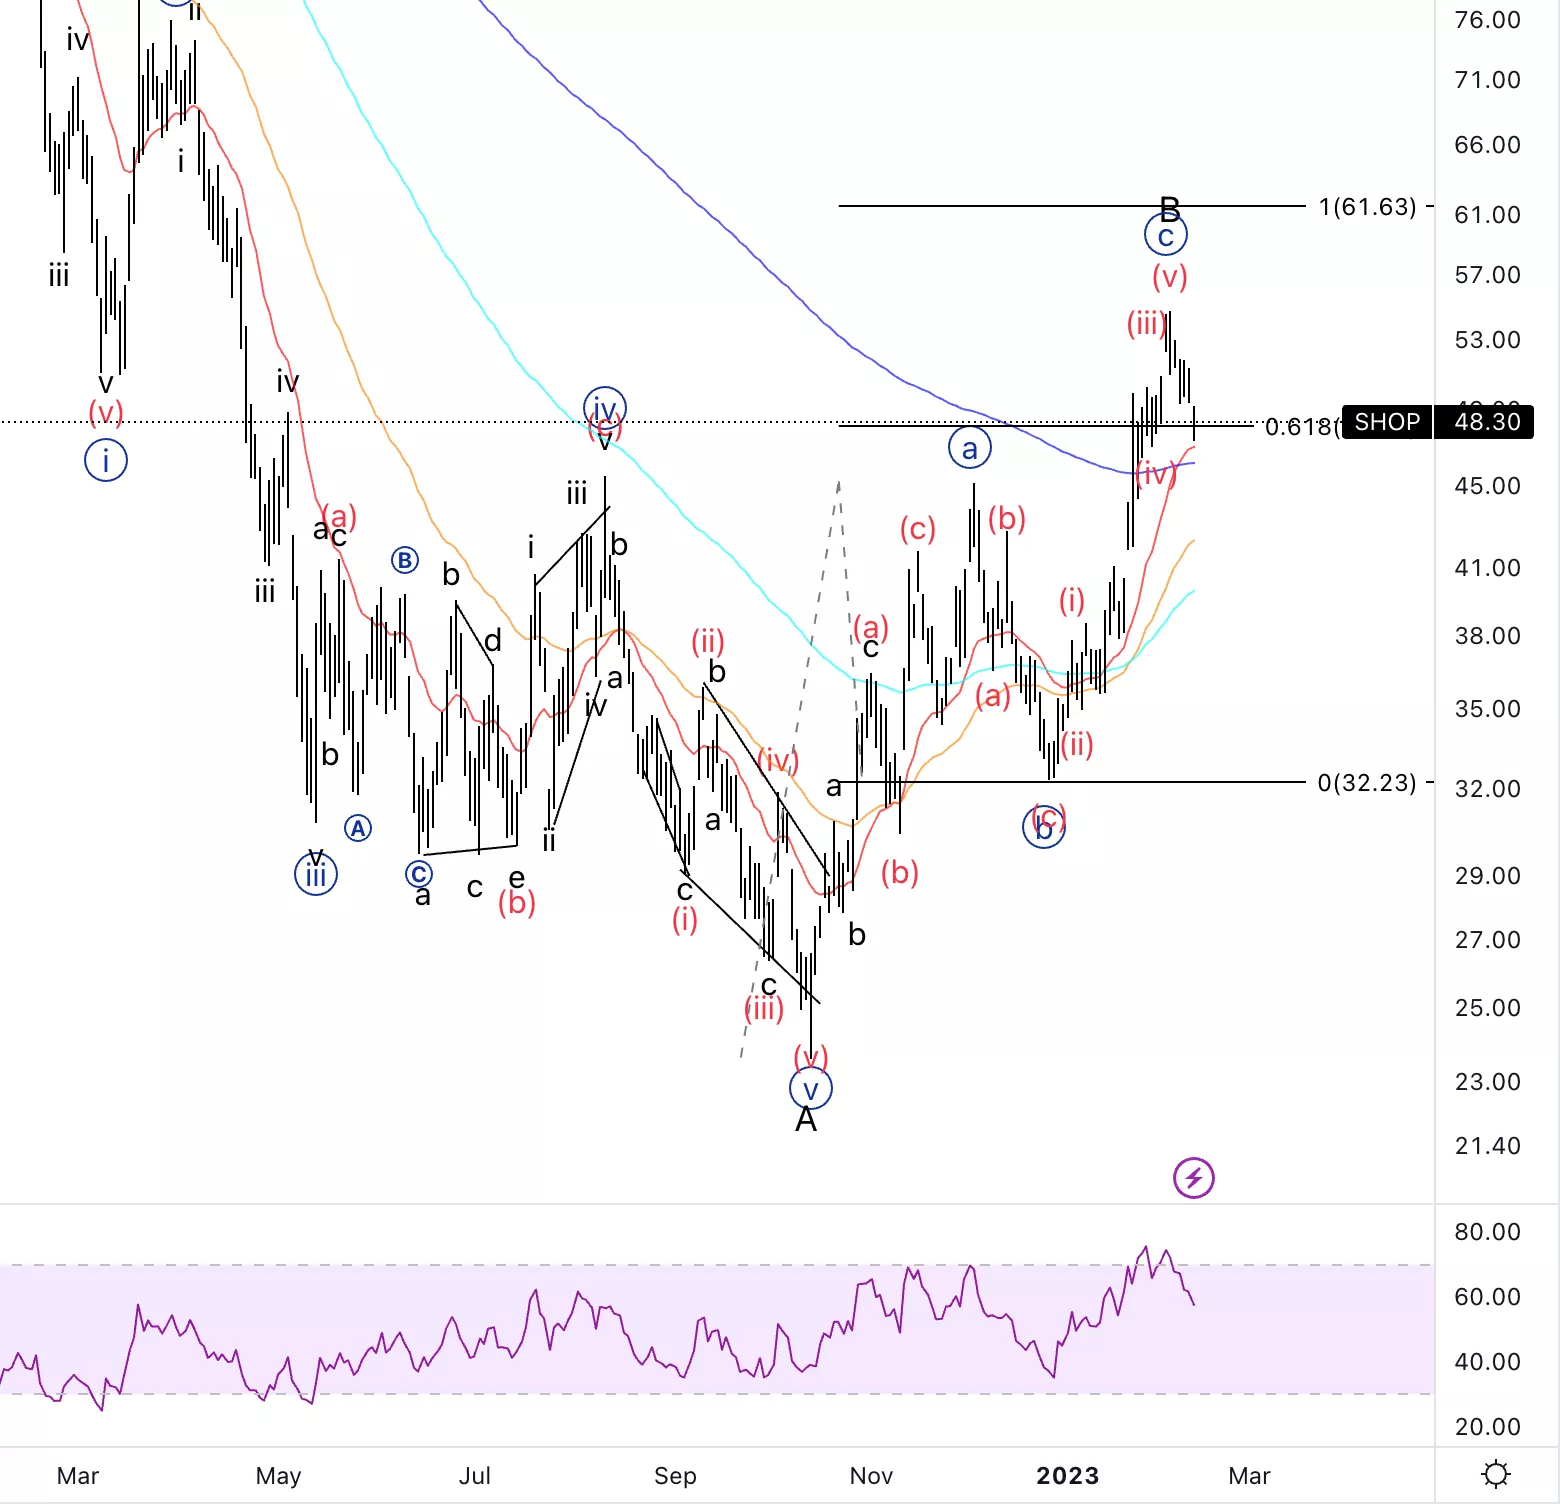
Shopify Inc., (SHOP): Daily Chart, Monday, Feb. 13
SHOP Stock Market Analysis: Moving as expected from the last update. At this point there isreason to believe we have completed the three wave move which could either be wave B as labelledor else wave {a} of B to then have a deeper retracement.
SHOP Elliott Wave Count: Wave (c) of B.
SHOP Technical Indicators:Above all averages.
SHOP Trading Strategy:Looking for further downside into either wave {i} of C or else wave (i)of {a}.
TradingLounge Analyst: Alessio Barretta
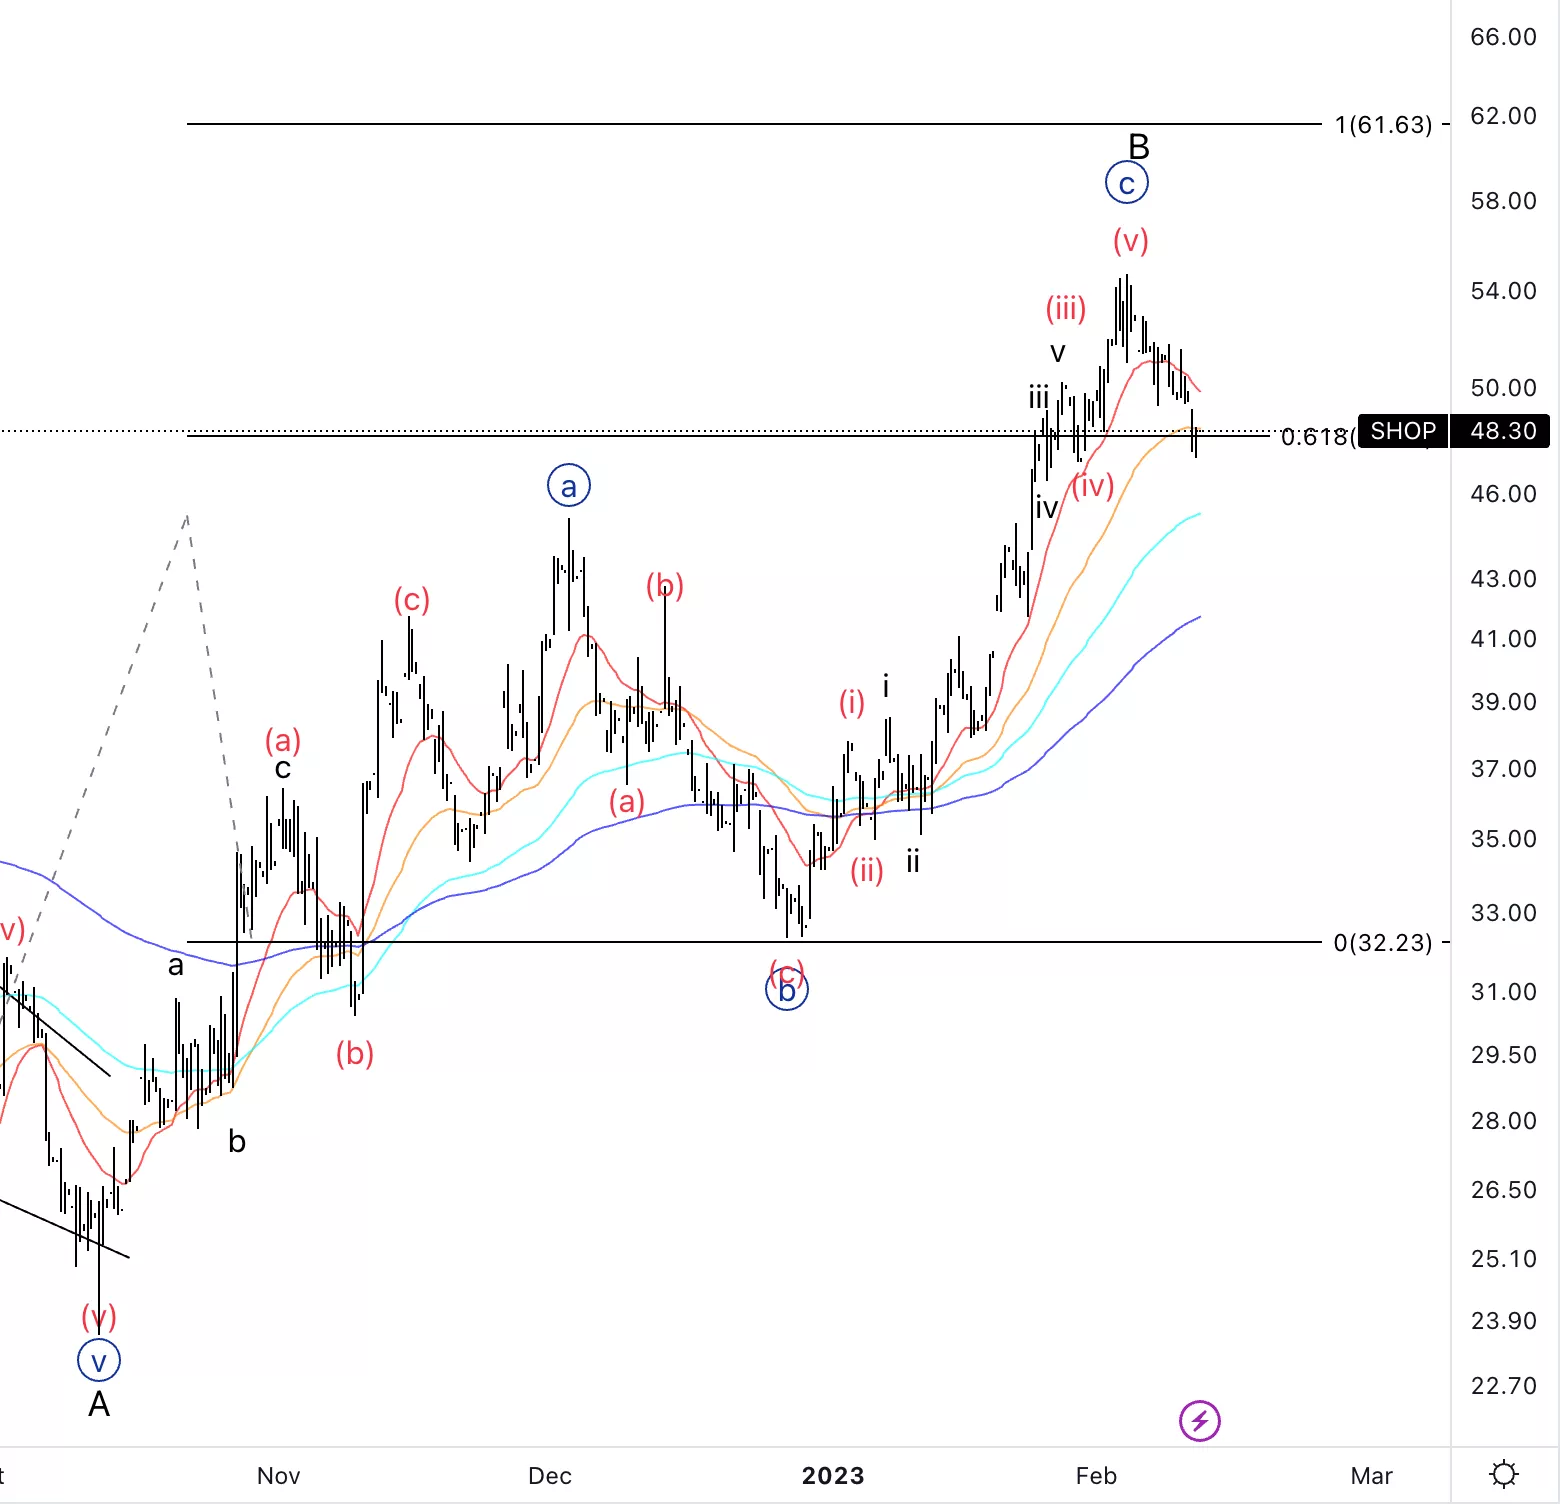
Shopify Inc., SHOP:4-hour Chart
Shopify Inc., Elliott Wave Technical Analysis
SHOP Stock Market Analysis: It seems like we have a complete five wave sequence into wave{c}. Looking for a clear five wave move to the downside before considering shorts.
SHOP Elliott Wave count: Wave {i} of C.
SHOP Technical Indicators: below 20EMA.
SHOP Trading Strategy:Looking for downside into wave C.
More By This Author:
Elliott Wave Technical Analysis: Cardano-USD, Monday, Feb 13
Elevate Your Trading Results With DAX 40 Index Chart And Elliott Wave Analysis
Elliott Wave Technical Analysis: Intuit Inc.


Comments
Log in or sign up to join the conversation.