

Photo by Austin Distel on Unsplash
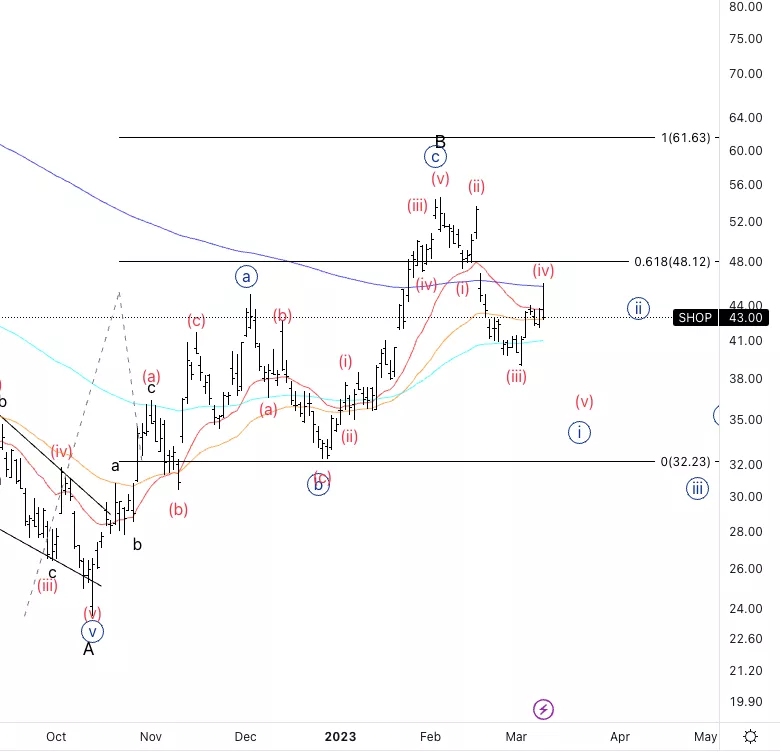
Shopify Inc., Elliott Wave Technical Analysis
Shopify Inc., (Nasdaq: SHOP): Daily Chart, 10 March 2023.
SHOP Stock Market Analysis: Looking for five waves to the downside into wave {i} as we are assuming we have completed a three wave move to the upside in wave B.
SHOP Elliott Wave Count: Wave (iv) of {i}.
SHOP Technical Indicators: Below 20 and 200EMA average.
SHOP Trading Strategy: Looking for shorts into wave (v).
Analyst: Alessio Barretta
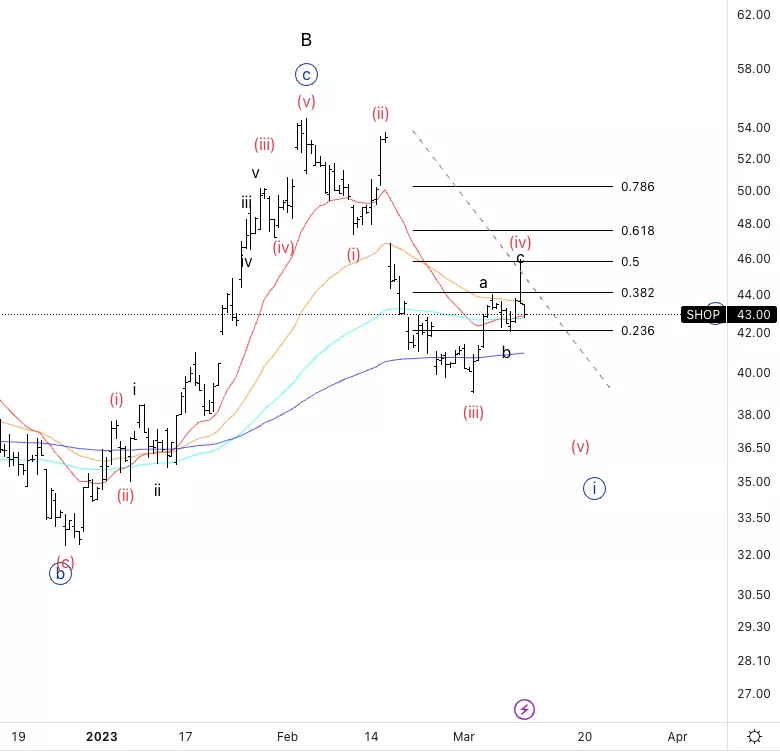
Shopify Inc., SHOP: 4-hour Chart, 10 March 2023.
Shopify Inc., Elliott Wave Technical Analysis
SHOP Stock Market Analysis: Looking for a downside in wave (v) already, we have a three wave move into wave (iv).
SHOP Elliott Wave count: Wave i of (v).
SHOP Technical Indicators: Below 20EMA
SHOP Trading Strategy: Looking for shorts into wave (v).
More By This Author:
Elliott Wave Technical Analysis: U.S. Stocks
Okta Inc. Elliott Wave Technical Analysis 9 March 23
Elliott Wave Trading: Thursday, March 9 - SP500 - Nasdaq - Russell 2000 - Dow Jones


Comments
Log in or sign up to join the conversation.