

O'Reilly Automotive Inc., Elliott Wave Technical Analysis

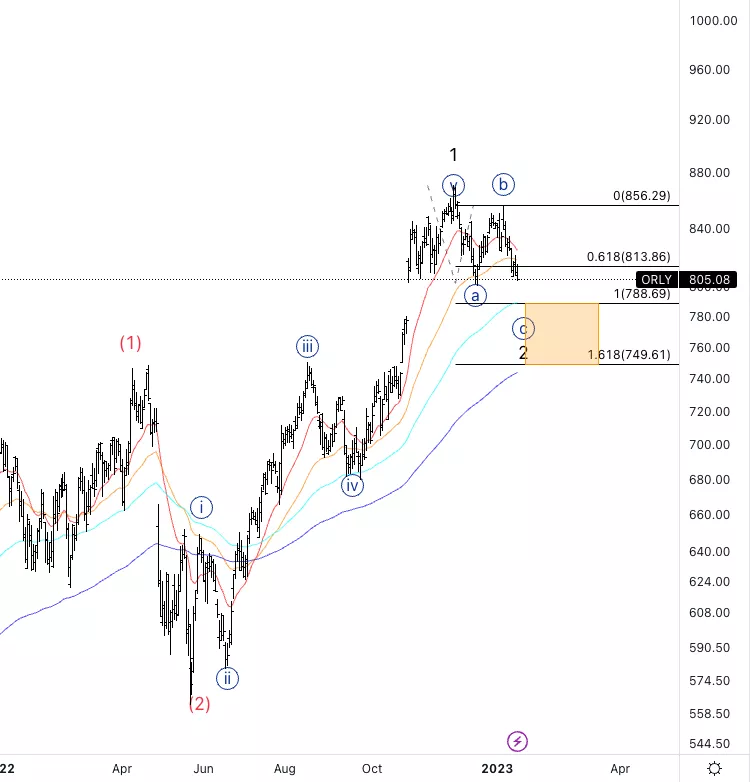
O'Reilly Automotive Inc., (ORLY): Daily Chart, January 19, 2023
ORLY Stock Market Analysis: Looking for a larger retracement into wave 2 to possibly take us back to fill the gap around 780$.
ORLY Elliott Wave Count: Wave {c} of 2.
ORLY Technical Indicators: In between averages.
ORLY Trading Strategy: Looking for the end of wave 2 to enter long.
TradingLounge Analyst: Alessio Barretta
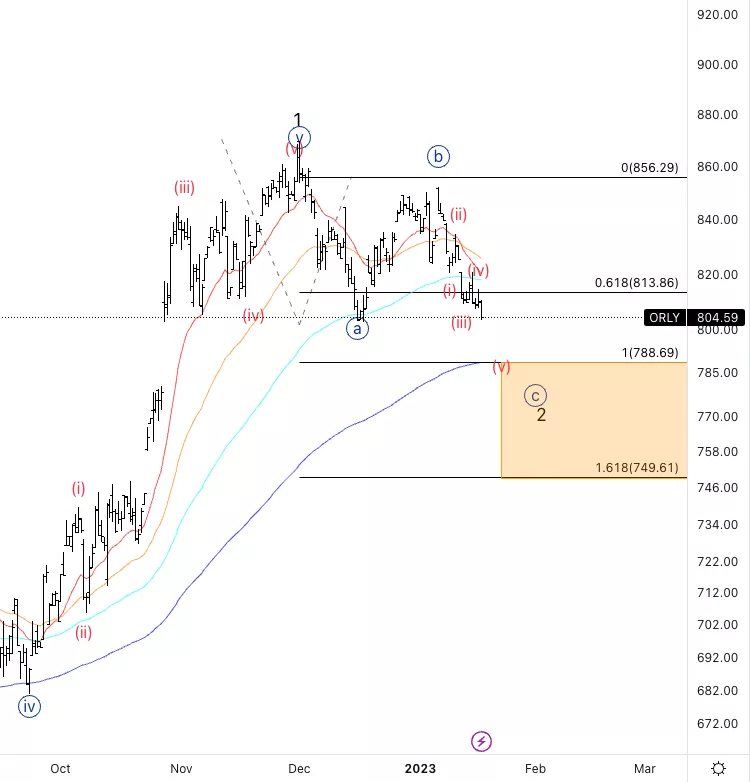
O'Reilly Automotive Inc., ORLY: 4-hour Chart, January 19, 2023
O'Reilly Automotive Inc., Elliott Wave Technical Analysis
ORLY Stock Market Analysis: Looking for downside into wave {c}, unfolding as expected. The count the way it is right now would only allow for a wave (v) shorter than (iii) therefore it’d mean having a short wave {c}. That means we could possibly be in wave (i) of {c} instead.
ORLY Elliott Wave count: Wave (v) of {c}.
ORLY Technical Indicators: Below all averages but the 200EMA.
ORLY Trading Strategy: Looking for downside to ends wave {c}.
More By This Author:
U.S. Stock Market Report - Elliott Wave Analysis
BNBUSD Elliott Wave Technical Analysis For Thursday, January 19
Elliott Wave Technical Analysis: Netflix - Jan. 18



Comments
Log in or sign up to join the conversation.