

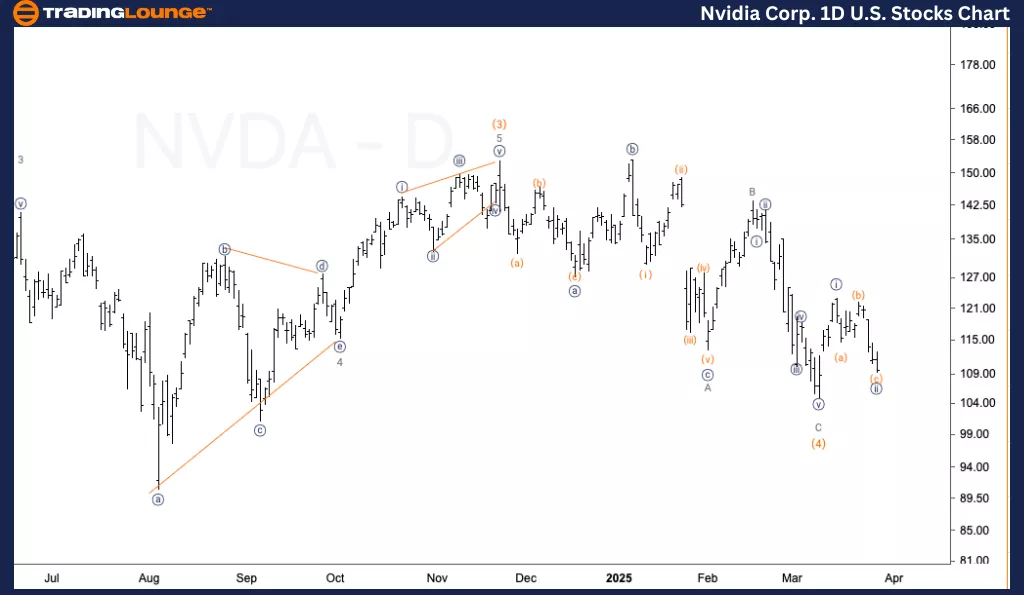
Nvidia Corp. (NVDA) – Daily Chart
- Mode: Corrective
- Function: Counter Trend
- Structure: Flat
- Position: Wave (4)
- Direction: Bottom in wave (4)
- Details: Exploring a possible bottom in wave (4) after a five-wave move into wave {i}, followed by a three-wave corrective move in wave {ii}.
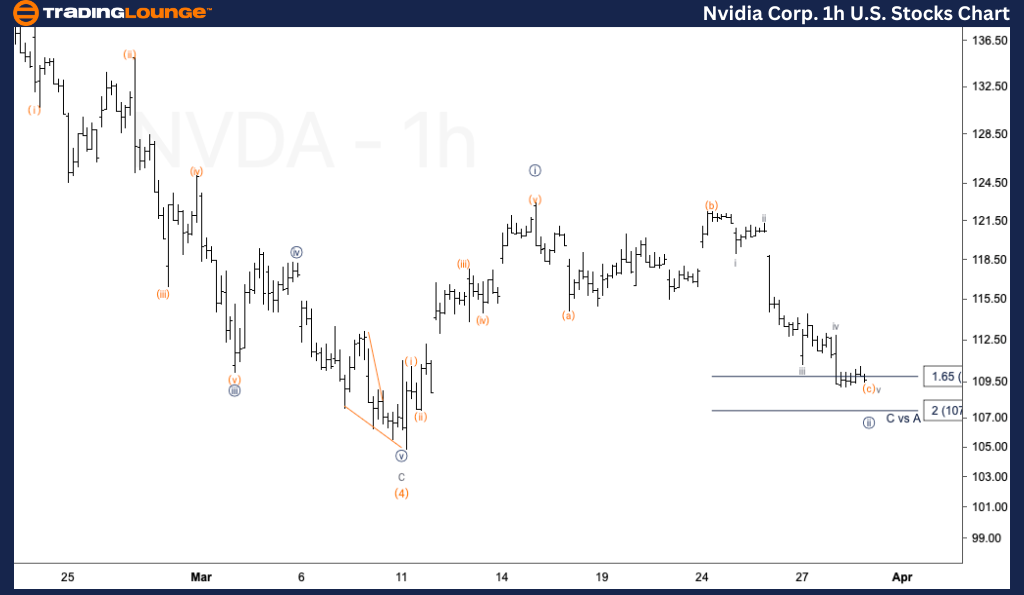
Nvidia Corp. (NVDA) – 1-Hour Chart
- Mode: Corrective
- Function: Counter Trend
- Structure: Flat
- Position: Wave (c) of {ii}
- Direction: Completion in wave {ii}
- Details: Watching closely for a bottom in wave (c). The price has surpassed the 1.618 level in relation to wave (a) and is approaching the 2.0 ratio. A reversal from this area would validate the current wave count; otherwise, the structure may be invalidated.
Technical Analyst : Alessio Barretta
More By This Author:
Unlocking ASX Trading Success: Insurance Australia Group Limited - Monday, March 31
Elliott Wave Technical Analysis: Nasdaq Index - Monday, March 31
Elliott Wave Technical Analysis: Binance Crypto Price



Comments
Log in or sign up to join the conversation.