

Netflix Inc., Elliott Wave Technical Analysis

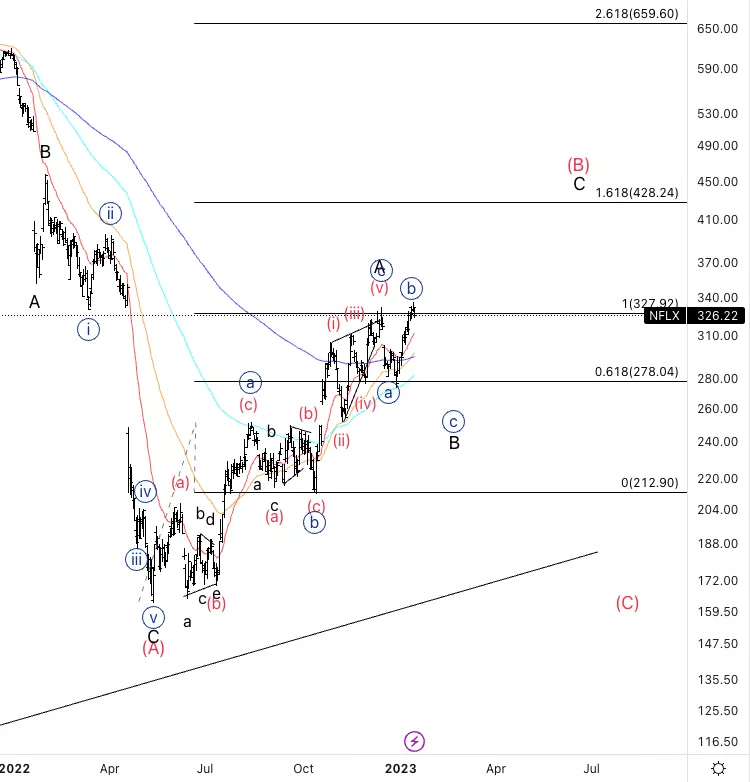
Netflix Inc., (NFLX): Daily Chart, January 18, 2023
NFLX Stock Market Analysis: At this point I changed the count moving everything down a degree to allow for a larger correction. I still expect downside into wave {c} of B and we’ll have confirmation soon.
NFLX Elliott Wave Count: Wave B of(B).
NFLX Technical Indicators: Above all averages
NFLX Trading Strategy: Looking forfurther confirmation to enter short.
TradingLounge Analyst: Alessio Barretta
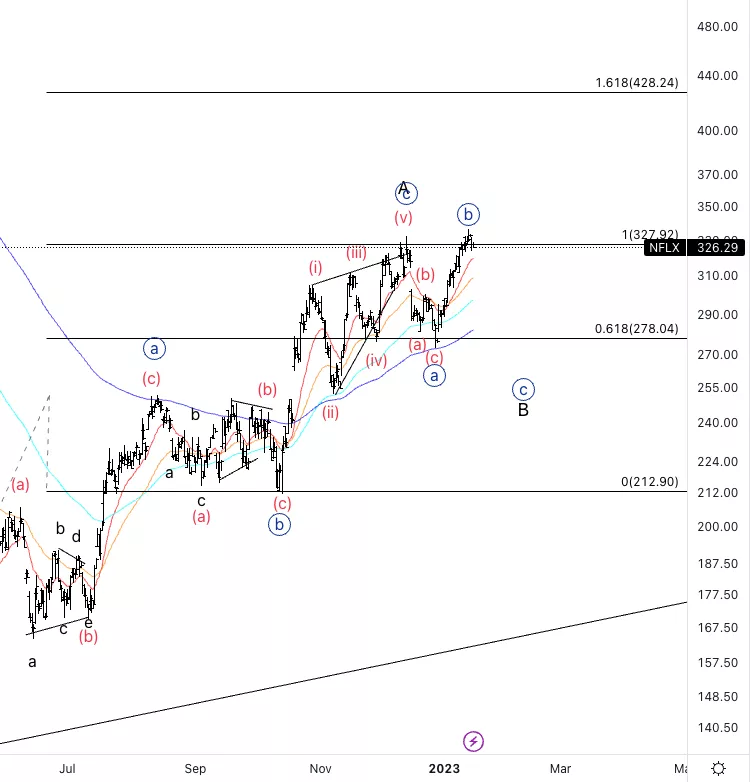
Netflix Inc., NFLX: 4-hour Chart, January 18, 2023
Netflix Inc., Elliott Wave Technical Analysis: As you can see the move down in potential wave {a} was a three wave move therefore we can have wave {b} breaking the top of {a}(flat correction).
NFLX Elliott Wave count: Wave{b} of B.
NFLX Technical Indicators: Above all averages
NFLX Trading Strategy: Looking for downside to start entering within wave {c}.
More By This Author:
Australian Stock Market Report - ASX200 Banks Resources Forex
Elliott Wave Technical Analysis: Binance / U.S. Dollar
Elliott Wave Technical Analysis: S&P 500 Index And Market Overview - Tuesday, Jan. 17



Comments
Log in or sign up to join the conversation.