


Photo by Quantitatives on Unsplash
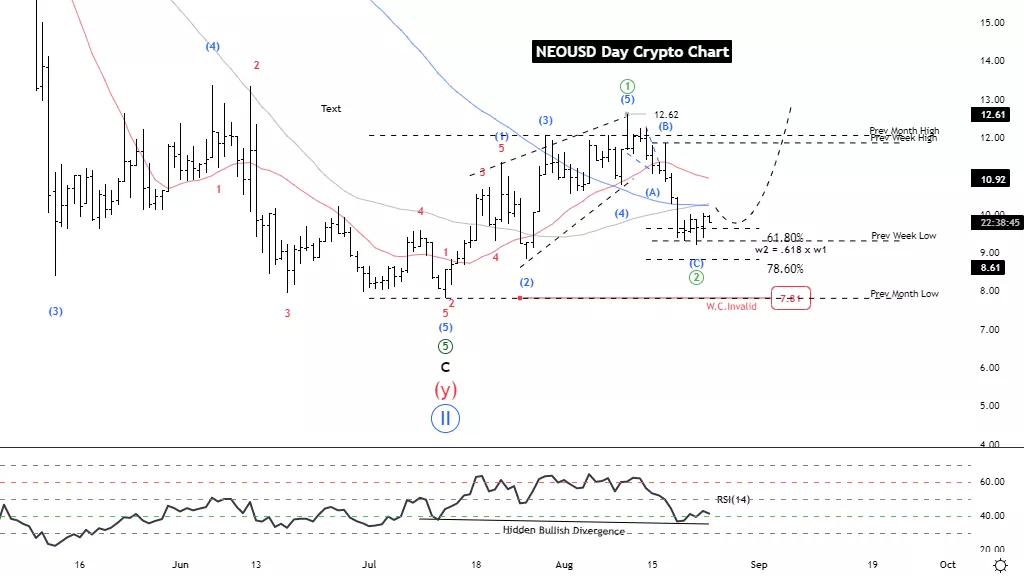
Elliott Wave Analysis TradingLounge Daily Chart, 24 August 2022, NEO (NEOUSD)
NEOUSD Elliott Wave Technical Analysis
Elliott Wave Technical Analysis
Function: Counter trend
Mode: Corrective
Structure: Zigzag
Position: Wave C
Direction Next higher Degrees: wave ((2)) of Impulse Details: A decline in a wave that accumulates power to continue its uptrend is usual y retracement equal to 0.50% or 0.618% of the length of the first wave.
Wave Cancel invalid Level: 7.83
NEO (NEOUSD) Trading Strategy: Rebounding from last week's lows But still can't rise above the MA line, but even so, the view is still a throwback to continue the uptrend.
Waiting for clarity again
NEO (NEOUSD) Technical Indicators: the RSI is signaling a Hidden Bullish divergence.
Analyst: Kittiampon Somboonsod
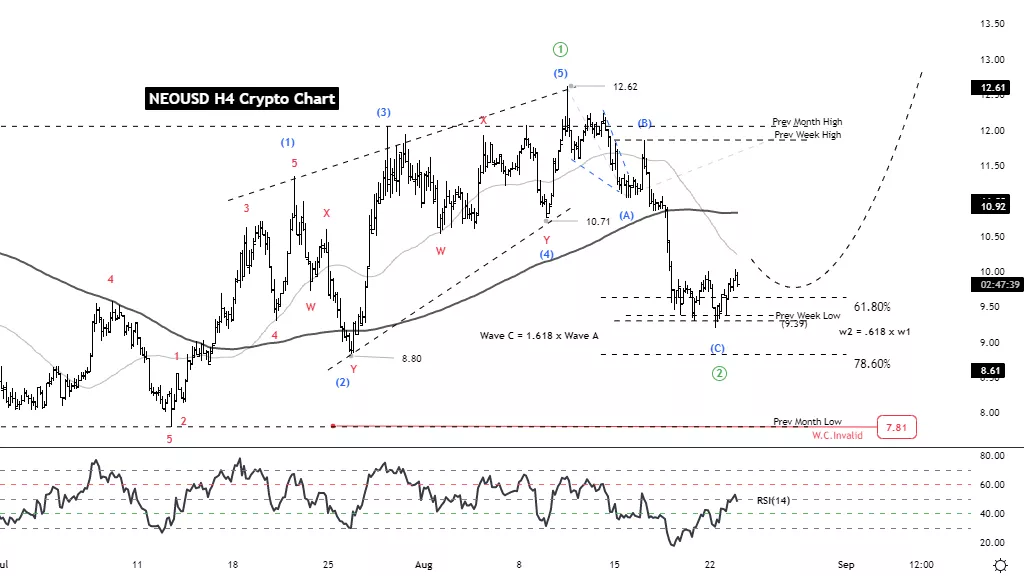
Elliott Wave Analysis TradingLounge 4H Chart, 24 August 2022, NEO (NEOUSD)
NEOUSD Elliott Wave Technical Analysis
Elliott Wave Technical Analysis
Function: Counter trend
Mode: Corrective
Structure: Zigzag
Position: Wave C
Direction Next higher Degrees: wave ((2)) of Impulse Details: A decline in a wave that accumulates power to continue its uptrend is usual y retracement equal to 0.50% or 0.618% of the length of the first wave.
Wave Cancel invalid Level: 7.83
NEO (NEOUSD) Trading Strategy: Rebounding from last week's lows But still can't rise above the MA200 line, but even so, the view is still a throwback to continue the uptrend.
Waiting for clarity again
NEO (NEOUSD) Technical Indicators: the RSI is signaling a Bullish divergence.
More By This Author:
SP500 Elliott Wave Analysis: Wave V) Of A - Protect Profits Trailing Stops
Elliott Wave Technical Analysis: Binance Coin
Nvidia - Elliott Wave Technical Analysis For Aug. 23



Comments
Log in or sign up to join the conversation.