


Image Source: Pixabay
Intuitive Surgical Inc., Elliott Wave Technical Analysis
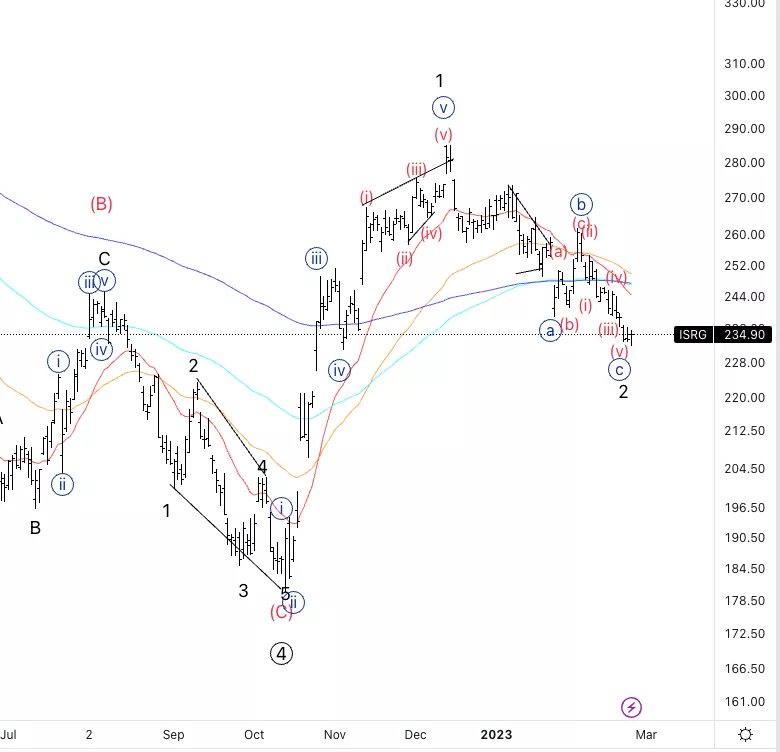
Intuitive Surgical Inc., (Nasdaq: ISRG): Daily Chart, 24 February 2023.
ISRG Stock Market Analysis: Looking for a completion of wave 2 t come soon as it seems to have unfolded as predicted.
ISRG Elliott Wave Count: Wave {c} of 2.
ISRG Technical Indicators: Below all averages.
ISRG Trading Strategy: Looking for a bottom in wave 2 to then look for longs.
Analyst: Alessio Barretta
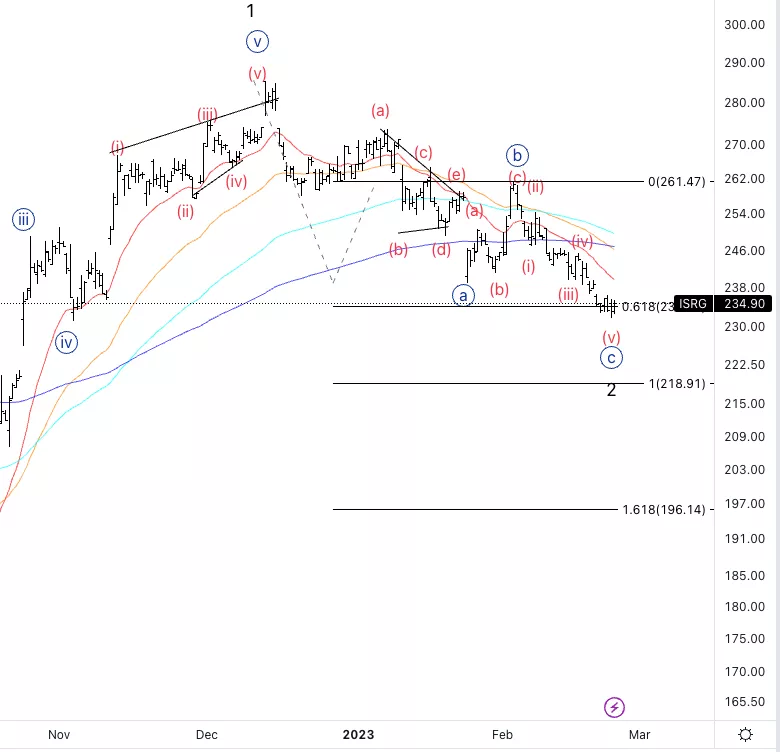
Intuitive Surgical Inc., ISRG: 4-hour Chart, 24 February 2023.
Intuitive Surgical Inc., Elliott Wave Technical Analysis
ISRG Stock Market Analysis: There is reason to believe wave {c} is completed as we also reached 0.618 {c} vs. {a} as well as we are in the area of wave {iv}.
ISRG Elliott Wave count: Wave {c} of 2.
ISRG Technical Indicators: Below all averages.
ISRG Trading Strategy: Looking for a bottom in wave 2 to then look for longs.
More By This Author:
Elliott Wave Technical Analysis: US Stocks
Elliott Wave Technical Analysis: O'Reilly Automotive, Thursday, Feb. 23
Polkadot /U.S.dollar (DOTUSD) Elliott Wave Technical Analysis



Comments
Log in or sign up to join the conversation.