

Photo by Yiorgos Ntrahas on Unsplash
Intercontinental Exchange Inc., Elliott Wave Technical Analysis
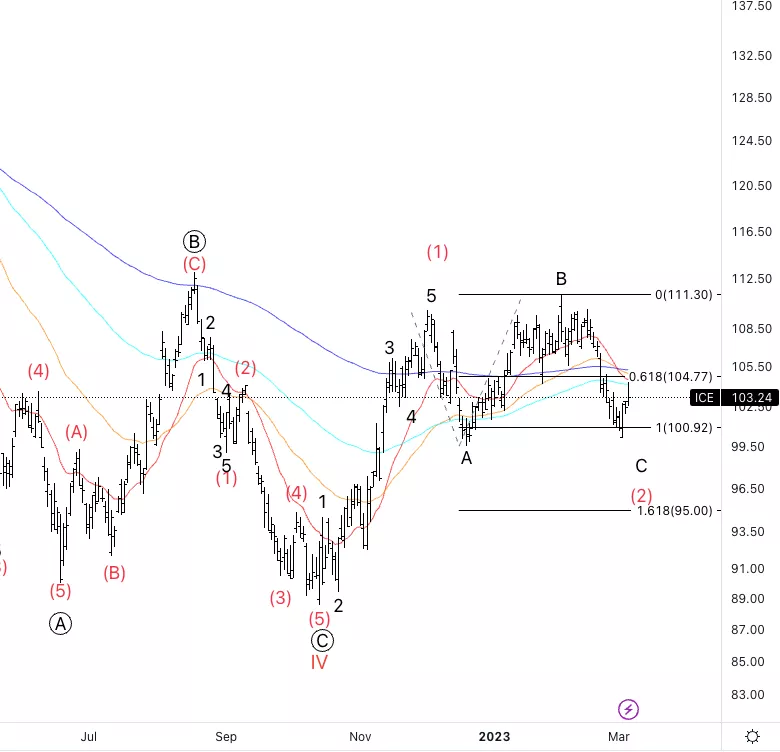
Intercontinental Exchange Inc., (NYSE: ICE): Daily Chart, 7 March 2023.
ICE Stock Market Analysis: Looking for a three wave move into wave (2) to then resume to the upside. First we would also need to break wave B t have additional confirmation.
ICE Elliott Wave Count: Wave C of (2).
ICE Technical Indicators: Below all averages.
ICE Trading Strategy: Looking for a bottom in wave C to then look for longs.
Analyst: Alessio Barretta
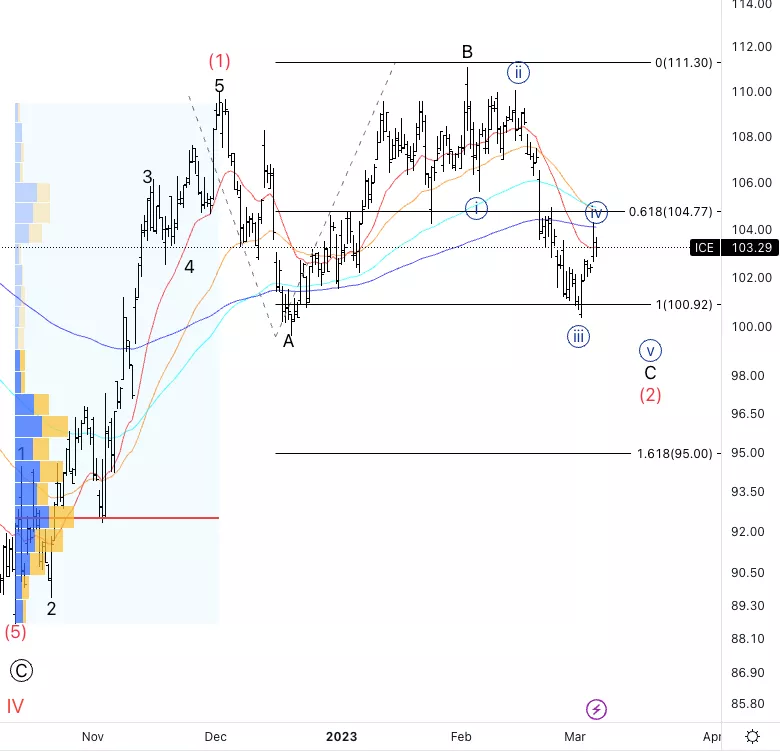
Intercontinental Exchange Inc., ICE: 4-hour Chart, 7 March 2023.
Intercontinental Exchange Inc., Elliott Wave Technical Analysis
ICE Stock Market Analysis: Looking for another leg down into wave {v} of C as we currently only have three waves to the downside.
ICE Elliott Wave count: Wave {iv} of C.
ICE Technical Indicators: 20 and 200EMA as resistance.
ICE Trading Strategy: Looking another leg lower which could be traded in lower time frames.
More By This Author:
Elliott Wave Technical Analysis: Bitcoin/US Dollar, Tuesday, March 7
European Stock Market Elliott Wave Investing AndTrading Strategies
Elliott Wave Technical Analysis: Spotify Inc.


Comments
Log in or sign up to join the conversation.