


Image Source: Unsplash
Intel Corp., Elliott Wave Technical Analysis
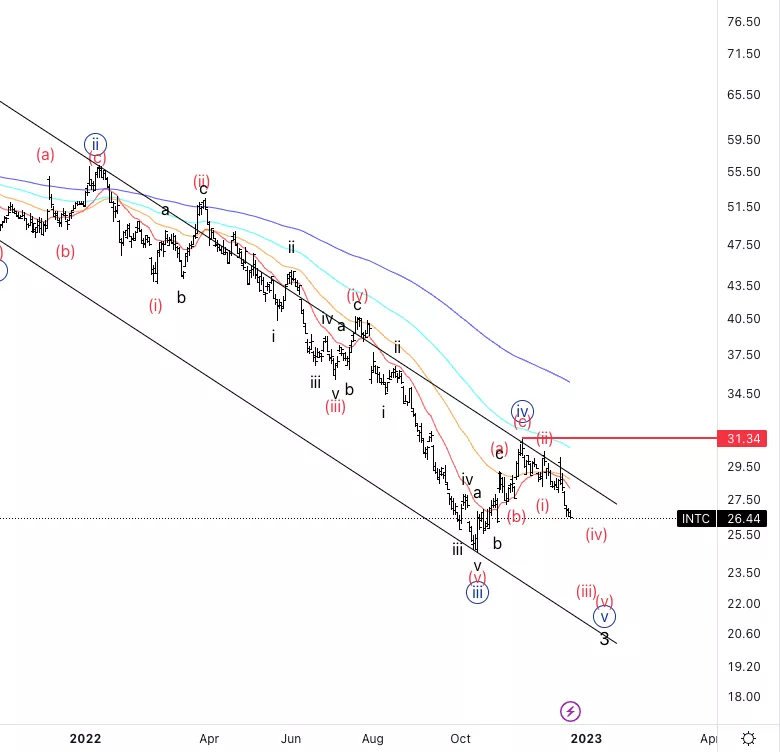
Intel Corp., (Nasdaq: INTC): Daily Chart, December 21, 2022,
INTC Stock Market Analysis: Price has been moving as expected, almost a textbook scenario. We bounced off the parallel channel and we are now extending lower. Looking for wave {iii} to be broken as wave {iv} seems to be finished.
INTC Elliott Wave Count: Wave (iii) of {v}.
INTC Technical Indicators: Below all averages.
INTC Trading Strategy: Looking for shorts into wave (v).
Analyst: Alessio Barretta
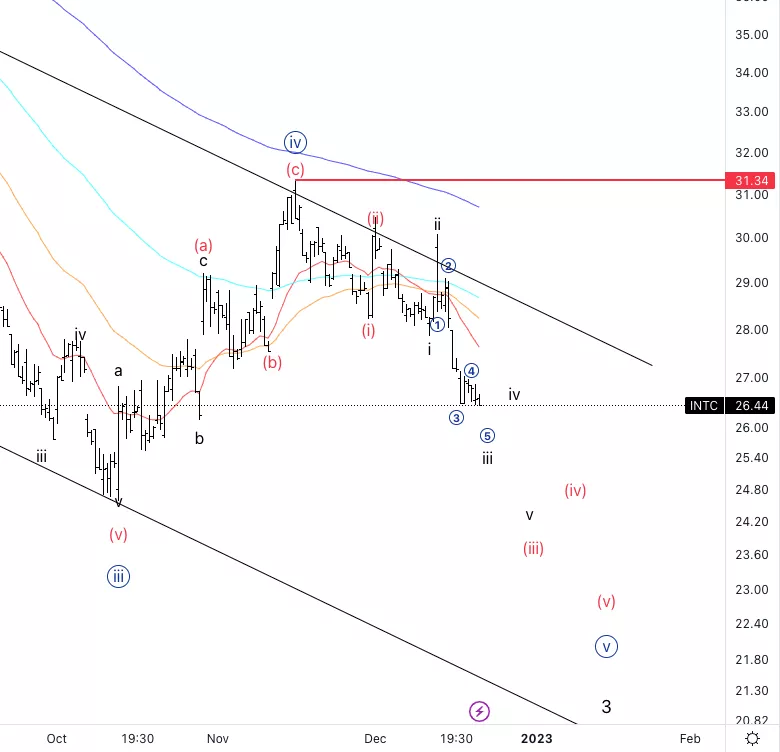
Intel Corp., INTC:4-hour Chart, December 21, 2022
Intel Corp., Elliott Wave Technical Analysis
INTC Stock Market Analysis: We can see how it is accelerating to the downside as we are in wave iii of (iii) which confirms the overall count. Looking for a pullback in wave iv soon.
INTC Elliott Wave count: Wave iii of (iii).
INTC Technical Indicators: Below all averages.
INTC Trading Strategy: Looking for shorts into wave v on the pullback in iv. We could get wave iv trying to look for resistance on the 20EMA.
More By This Author:
Elliott Wave Analysis Of U.S. Tech And Finance Giants
Elliott Wave Technical Analysis: Analog Devices Inc. - Tuesday, Dec. 20
Elliott Wave Technical Analysis: NEO/U.S. Dollar



Comments
Log in or sign up to join the conversation.