


Photo by Maxim Hopman on Unsplash
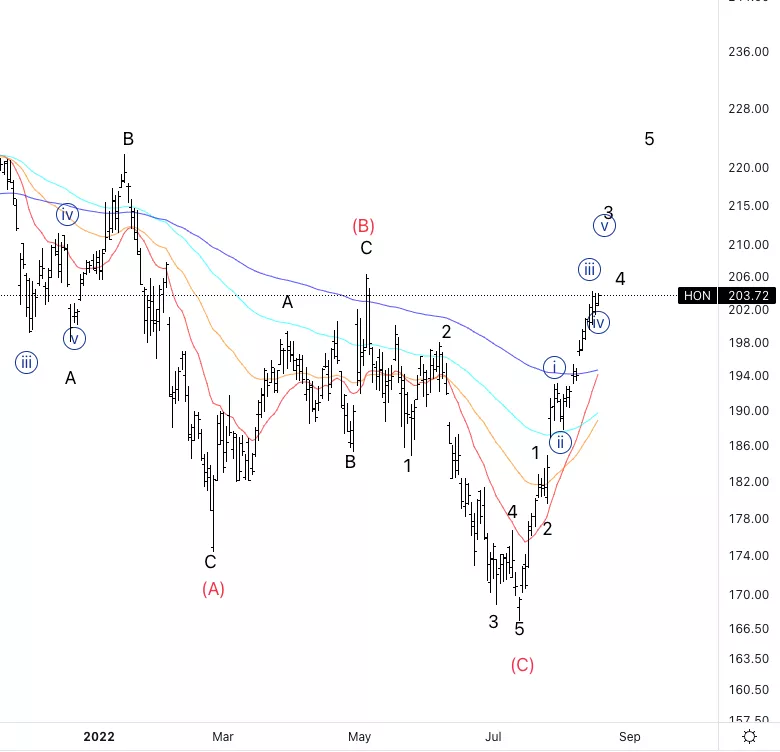
Honeywell International Inc.,(Nasdaq: HON): Daily Chart, August 19, 2022,
HON Stock Market Analysis: Looking for a resumption of the overall uptrend. The move of the low appears to be impulsive as we can count a potential five-wave move.
HON Elliott Wave count: {v} of 3.
HON Trading Strategy: Looking for a break of wave (b) on the left and then potentially the end of wave 4 to then set up longs.
HON Technical Indicators: Above all EMAs and starting to form RSI divergence.
Analyst: Alessio Barretta
(Click on image to enlarge)
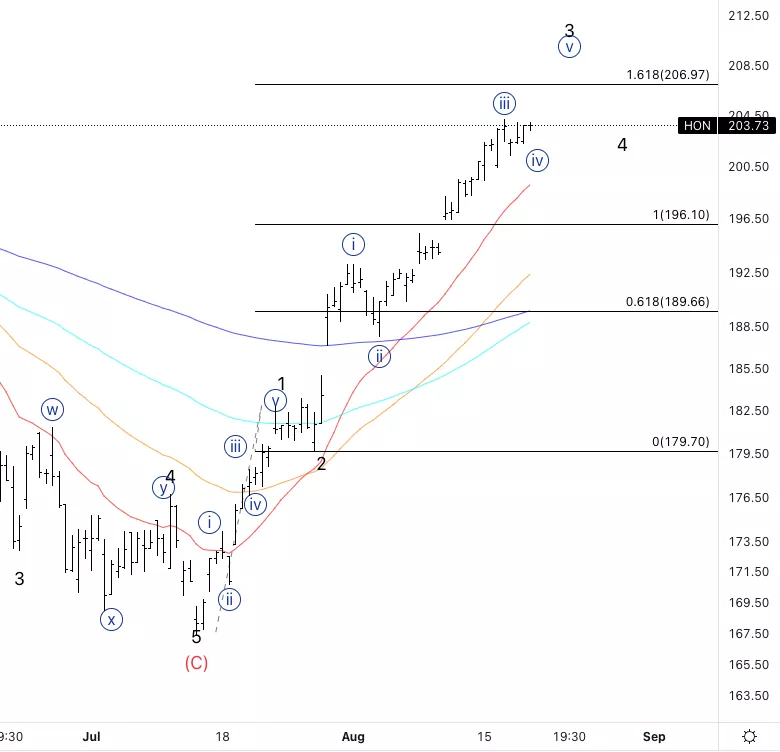
Honeywell International Inc., HON: 4-hour Chart, August 19, 2022,
Honeywell International Inc., Elliott Wave Technical Analysis
HON Stock Market Analysis: Looking for continuation higher, the 1.618 3vs 1 is at 207$ which represents the next target.
HON Elliott Wave count: Wave {v} of 3.
HON Technical Indicators: All technical indicators suggest further upside.
HON Trading Strategy: On short time frames every pullback should be supported therefore look for longs.
(Click on image to enlarge)
More By This Author:
U.S. Stocks Elliott Wave Analysis And Trading Strategies
Elliott Wave Technical Analysis: Texas Instruments Inc.
Elliott Wave Analysis: Dogecoin



Comments
Log in or sign up to join the conversation.