
Honeywell Inc., Elliott Wave Technical Analysis

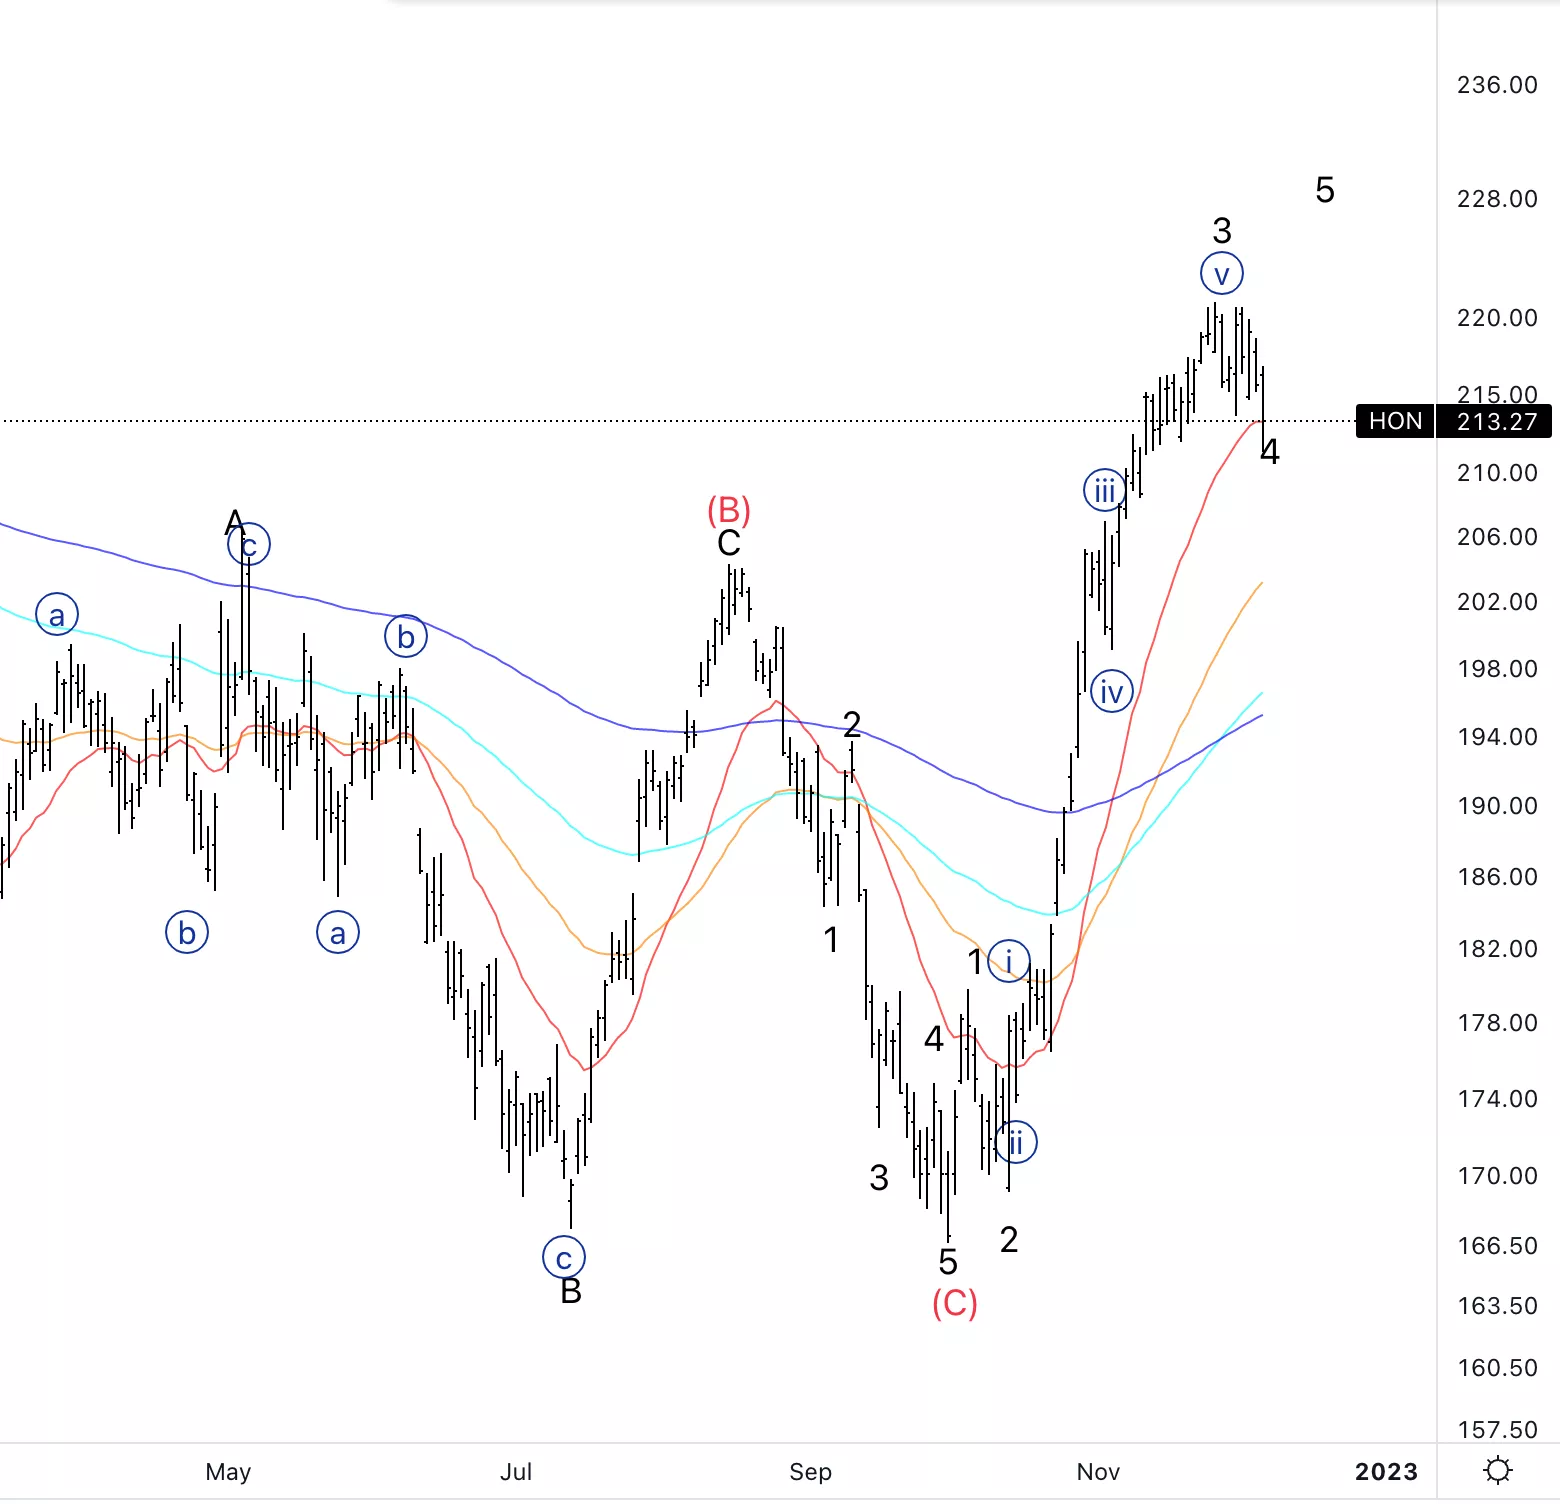
Honeywell Inc., (HON): Daily Chart, December 7, 2022
HON Stock Market Analysis: Moving as expected as we are entering potential wave 4 and for the time being finding support on the 20EMA
HON Elliott Wave Count: Wave 4 of (1).
HON Technical Indicators: Above all EMAs.
HON Trading Strategy: Looking for longs into wave 5 knowing the up side could be limited.
TradingLounge Analyst: Alessio Barretta
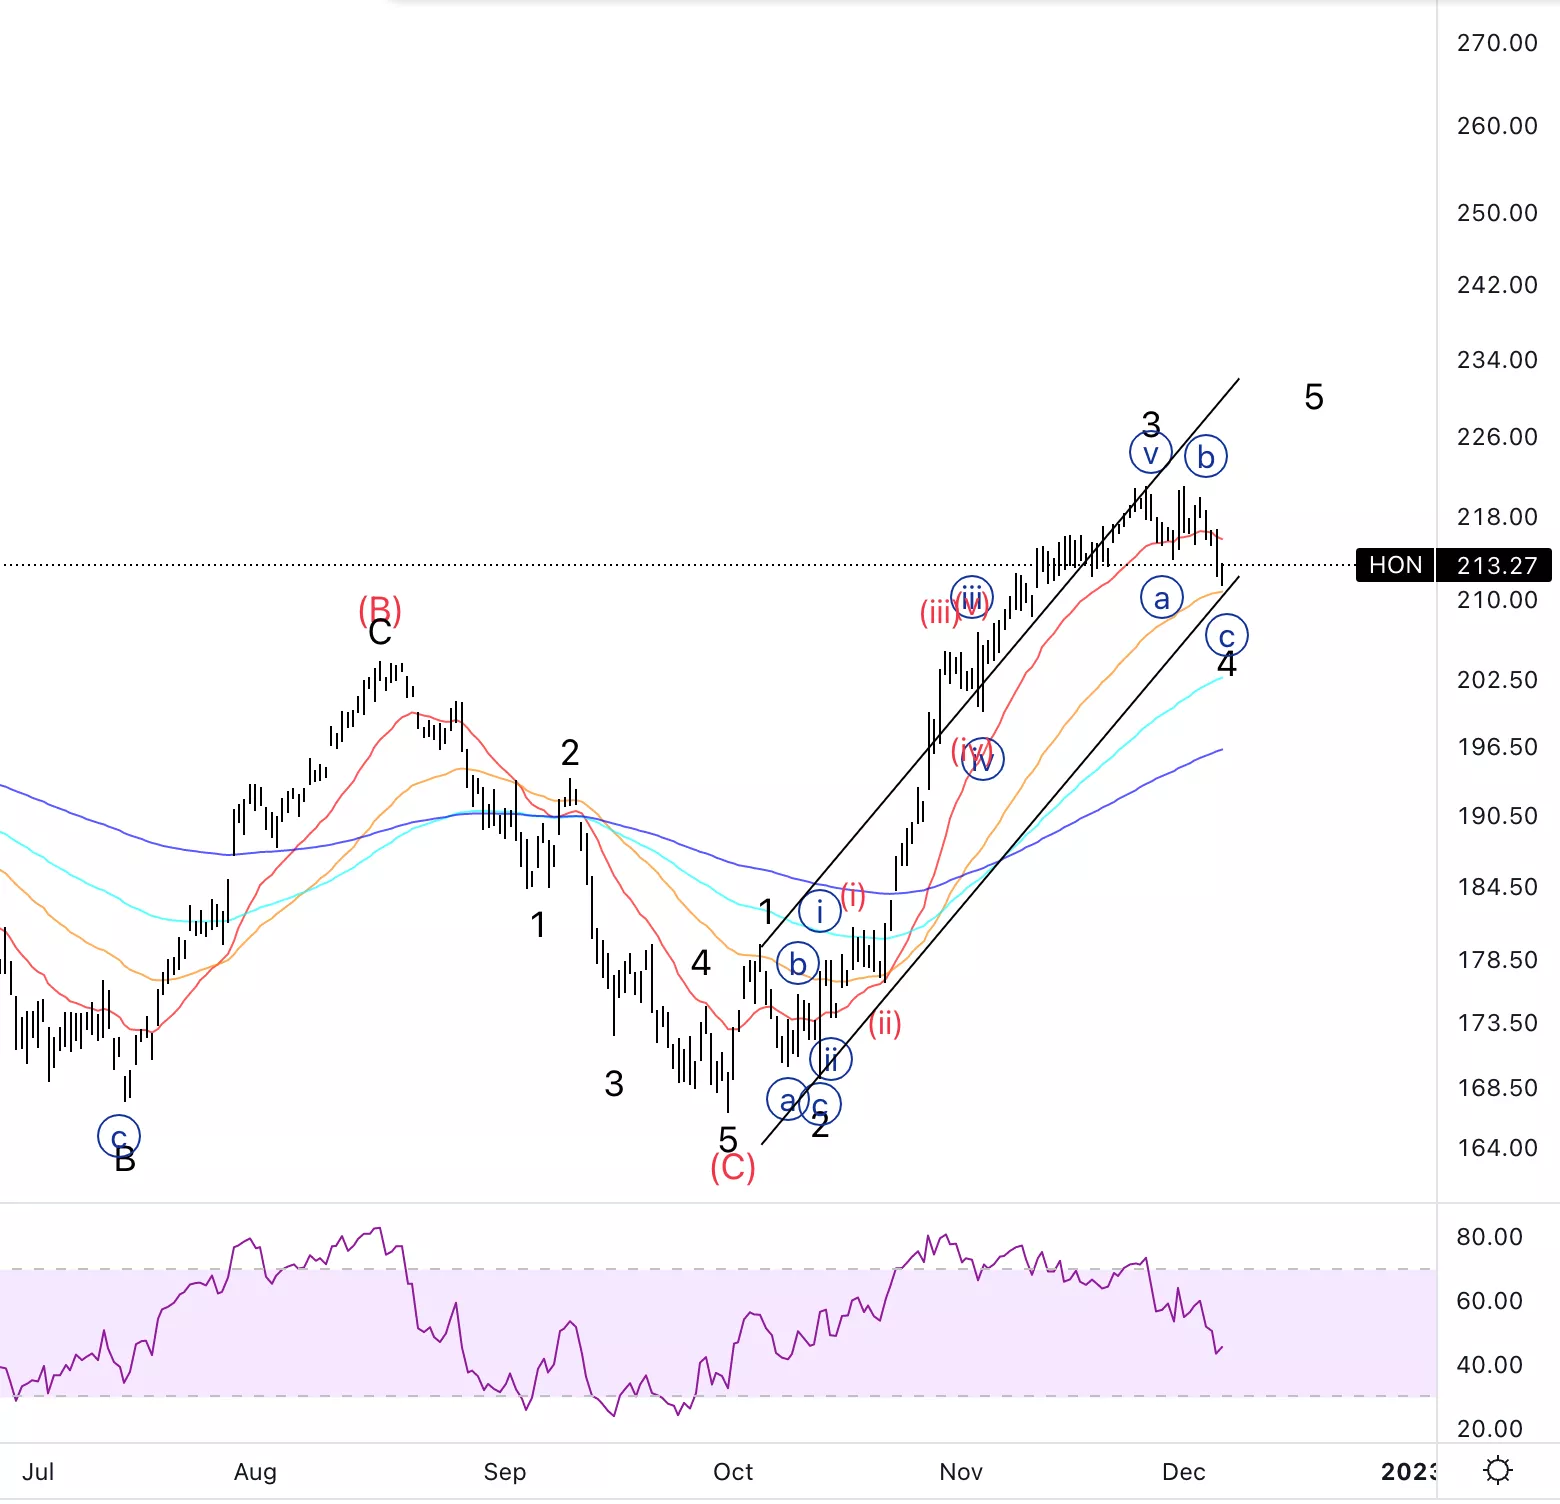
Honeywell Inc., HON: 4-hour Chart, December 7, 2022
Honeywell Inc., Elliott Wave Technical Analysis
HON Stock Market Analysis: So far the down move has been a three wave move which confirms the count allowing for further upside. We are also approaching the parallel trend channel which often times acts as support.
HON Elliott Wave count: Wave {c} of 4.
HON Technical Indicators: RSI slowly entering oversold territory.
HON Trading Strategy: Looking for longs into wave {v}.
More By This Author:
Elliott Wave Technical Analysis: Texas Instruments Inc. - Tuesday, Dec. 6
Elliott Wave Technical Analysis: Neo/US Dollar, Tuesday, Dec. 6
Elliott Wave Technical Analysis: Analog Devices, Monday, Dec. 5


Comments
Log in or sign up to join the conversation.