


Image Source: Unsplash
Honeywell Inc., Elliott Wave Technical Analysis
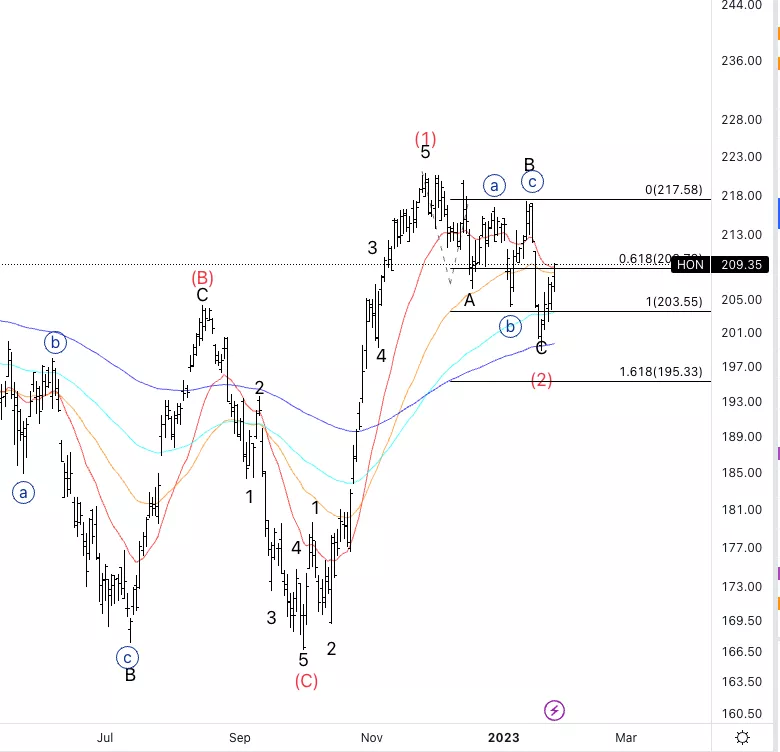
Honeywell Inc.,(Nasdaq: HON): Daily Chart, 27 January 23,
HON Stock Market Analysis: Honeywell has been moving as expected after a clear three-wave pullback which confirms the overall trend is to the upside. Looking for additional confirmation we are not going to double correct.
HON Elliott WaveCount: Wave{i} of1.
HON Technical Indicators: 20EMA as resistance.
HON Trading Strategy: Looking for a break of wave B to confirm longs.
Analyst: Alessio Barretta
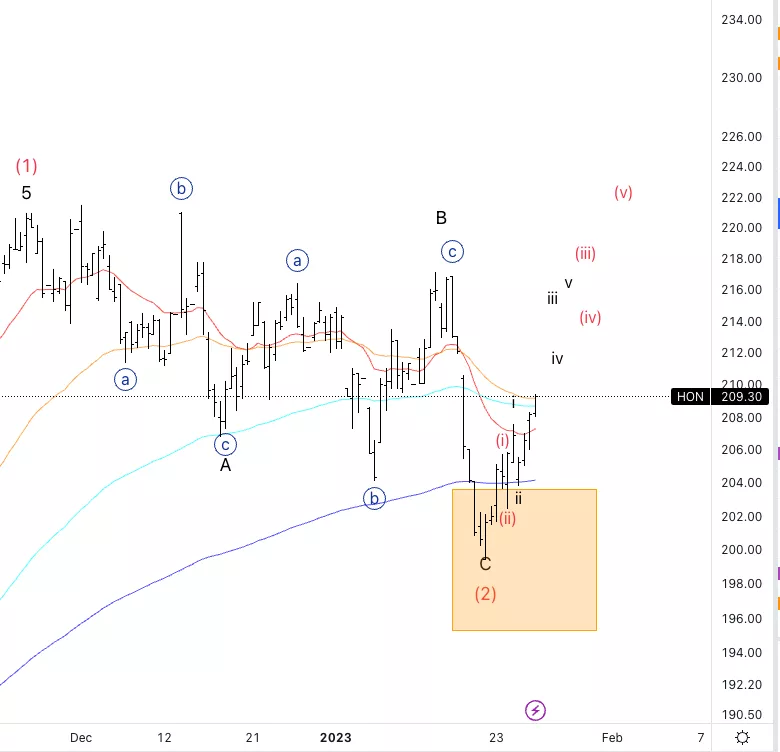
Honeywell Inc., HON: 4-hour Chart, 27 January 23,
Honeywell Inc., Elliott Wave Technical Analysis
HON Stock Market Analysis: As you can see it looks like we are extending into wave (iii) as wave (i) appears to be a clear five-wave sequence. If the count is correct we should see a sharp move to the upside.
HON Elliott Wave count: Wave iii of (iii).
HON Technical Indicators: Above all averages.
HON Trading Strategy: Waiting for a break of wave B.
More By This Author:
Elliott Wave Technical Analysis: Bitcoin / U.S. Dollar - Friday, Jan. 27
Commodity Markets:Lower Dollar & Yields, Higher Commodities
Elliott Wave Technical Analysis: Deere & Co., Thursday, Jan. 26



Comments
Log in or sign up to join the conversation.