


Image Source: Unsplash
Honeywell Inc., Elliott Wave Technical Analysis
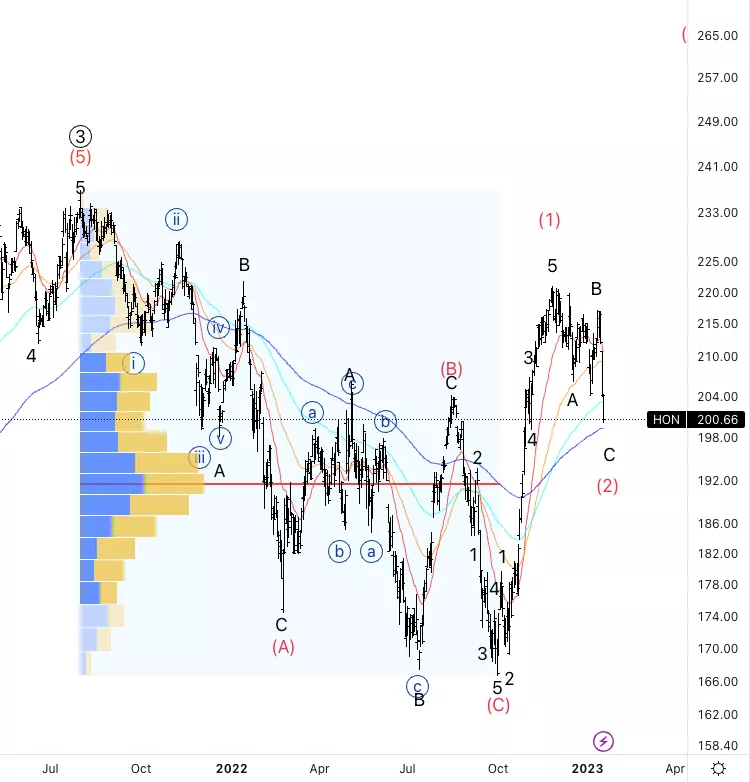
Honeywell Inc., (Nasdaq: HON): Daily Chart, 20 January 23,
HON Stock Market Analysis: Looking for a pullback in wave (2) to find support soon. We Broke the previous wave (B) which gives us additional confidence in the fact we are in a wave (1).
HON Elliott Wave Count: Wave C of (2).
HON Technical Indicators: Looking for support on the 200EMA
HON Trading Strategy: Looking for the end of wave (2) to enter long.
TradingLounge Analyst: Alessio Barretta
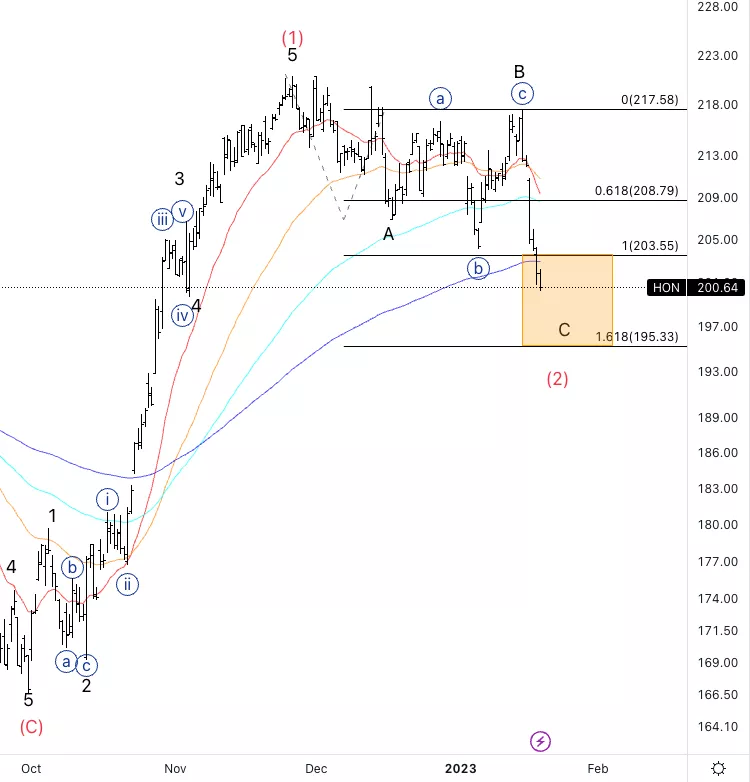
Honeywell Inc., HON: 4-hour Chart, 20 January 23,
Honeywell Inc., Elliott Wave Technical Analysis
HON Stock Market Analysis: We have reached and past equality of C vs. A and we barely passed the 200EMA. I would not like to see 1.618 being broken.
HON Elliott Wave count: Wave {v} of C.
HON Technical Indicators: Below all averages.
HON Trading Strategy: Waiting for a turn to start looking for longs.
More By This Author:
NEO Coin U.S.dollar(NEOUSD) Elliott Wave Technical Analysis 20 January 23
SP500 Elliott Wave Correction Lower To Continue, Today's Rally On Lower Volume
Elliott Wave Technical Analysis: O'Reilly Automotive Inc., Thursday, Jan. 19



Comments
Log in or sign up to join the conversation.