
Photo by Maxim Hopman on Unsplash
Fortinet Inc., Elliott Wave Technical Analysis
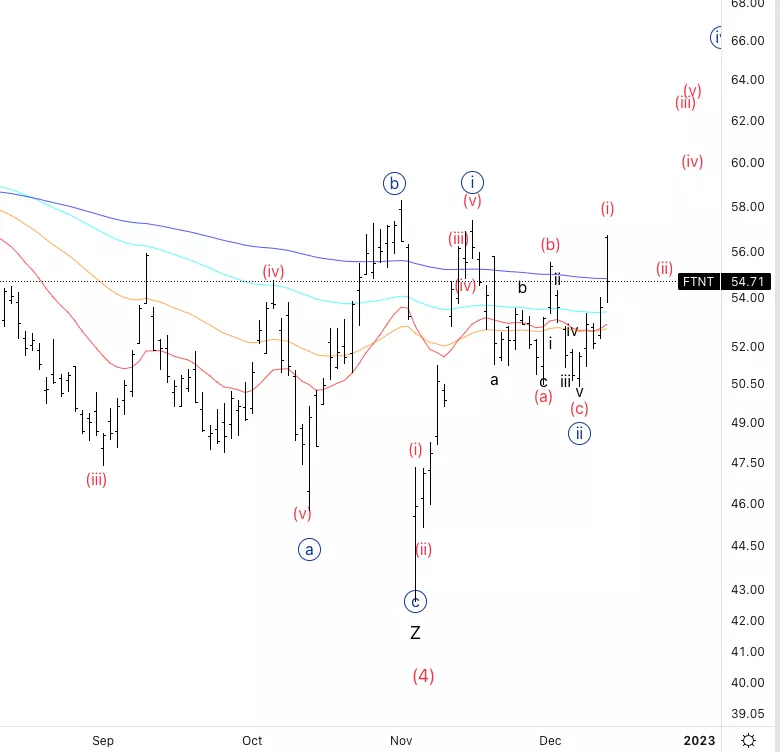
Fortinet Inc., (Nasdaq: FTNT): Daily Chart, December 14, 2022,
FTNT Stock Market Analysis: The stock has been moving as forecasted in the previous update. We are looking at the possibility of an uptrend resumption as we are trying to break previous highs.
FTNT Elliott Wave Count: Wave (i) of {iii}.
FTNT Technical Indicators: Looking for support on the 200EMA
FTNT Trading Strategy: Looking for longs on the pullback in wave (ii).
Analyst: Alessio Barretta
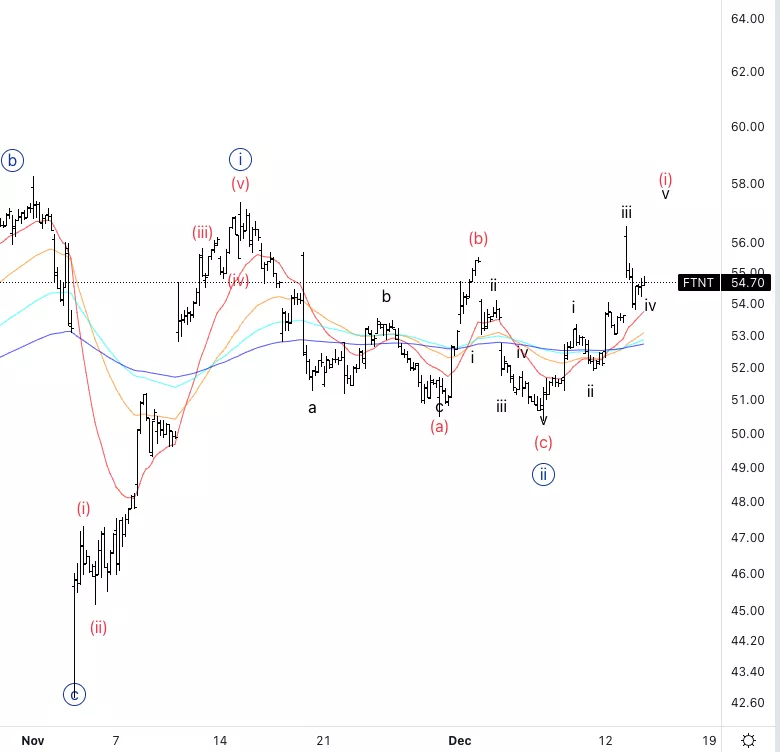
Fortinet Inc., FTNT: 1-hour Chart, December 14, 2022
Fortinet Inc., Elliott Wave Technical Analysis
FTNT Stock Market Analysis: Looking for a continuation higher into wave v of (i).
FTNT Elliott Wave count: Wave iv of (i).
FTNT Technical Indicators: Above all averages
FTNT Trading Strategy: Looking for longs into wave v with a stop on the top of wave I at around $53.5.
More By This Author:
Elliot Wave Technical Analysis: Tron/USD, Wednesday, Dec. 14
SP500 Elliott Wave Trading - TradingLounge Outlook, Wednesday, Dec. 14
Elliott Wave Technical Analysis: Honeywell International Inc., Tuesday, Dec. 13


Comments
Log in or sign up to join the conversation.