

Elbit Systems Ltd., Elliott Wave Technical Analysis

Image: Elbit Systems
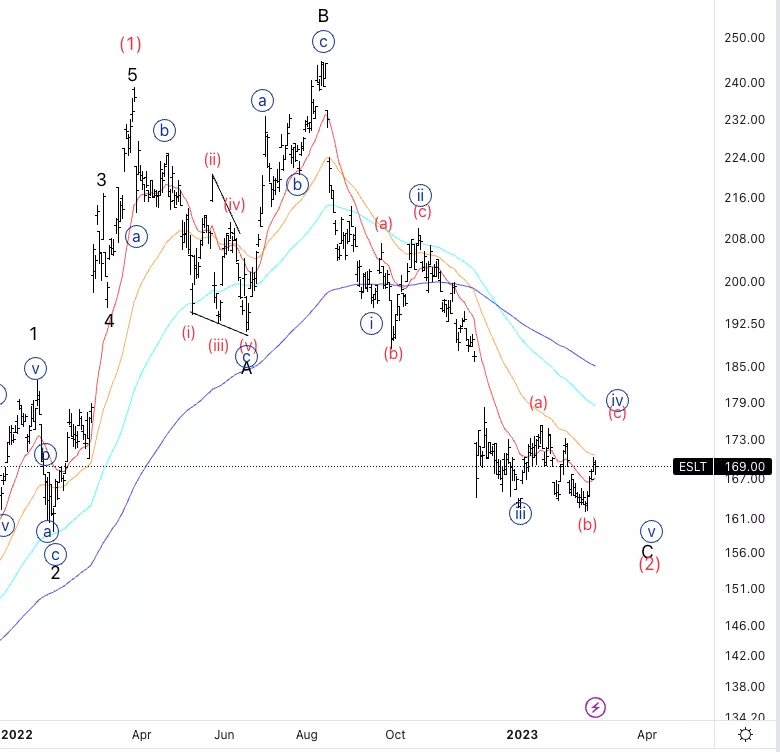
Elbit Systems Ltd., (ESLT): Daily Chart, Feb. 27
ESLT Stock Market Analysis: We are expecting five waves down into wave C of (2) after the sharp rally that we had until last summer. At this point we are looking for one last move lower before looking for upside.
ESLT Elliott Wave Count: Wave {v} of C.
ESLT Technical Indicators: Bouncing around the 20EMa.
ESLT Trading Strategy: Looking for one last move down before upside continuation.
TradingLounge Analyst: Alessio Barretta
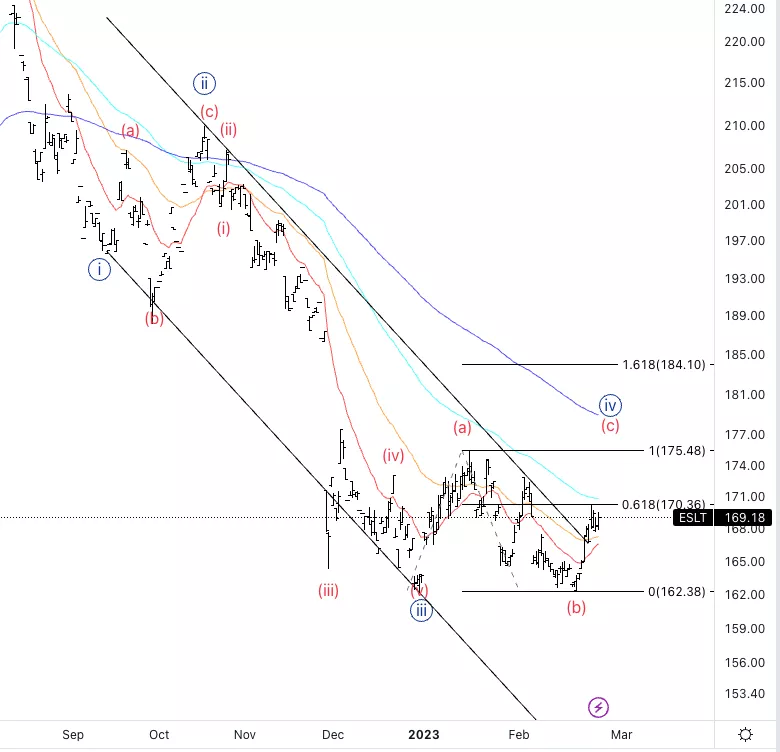
Elbit Systems Ltd., ESLT: 4-hour Chart, Feb. 27
Elbit Systems Ltd., Elliott Wave Technical Analysis
ESLT Stock Market Analysis: I was expecting a flat in wave {iv} as the most recent move down looked like a three wave move. Therefore I expect further upside to complete (c) to then resume lower.
ESLT Elliott Wave count: Wave (c) of {iv}.
ESLT Technical Indicators: Above 20EMA
ESLT Trading Strategy: Looking for further upside into wave (c) to then resume lower.
More By This Author:
Elliott Wave Technical Analysis: Ethereum /U.S. Dollar, Monday, Feb. 27
Elliott Wave Technical Analysis: Intuitive Surgical Inc. - Friday, Feb. 24
Elliott Wave Technical Analysis: Uniswap / U.S. Dollar - Friday, Feb. 24



Comments
Log in or sign up to join the conversation.