


Image Source: Pixabay
DexCom Inc., Elliott Wave Technical Analysis
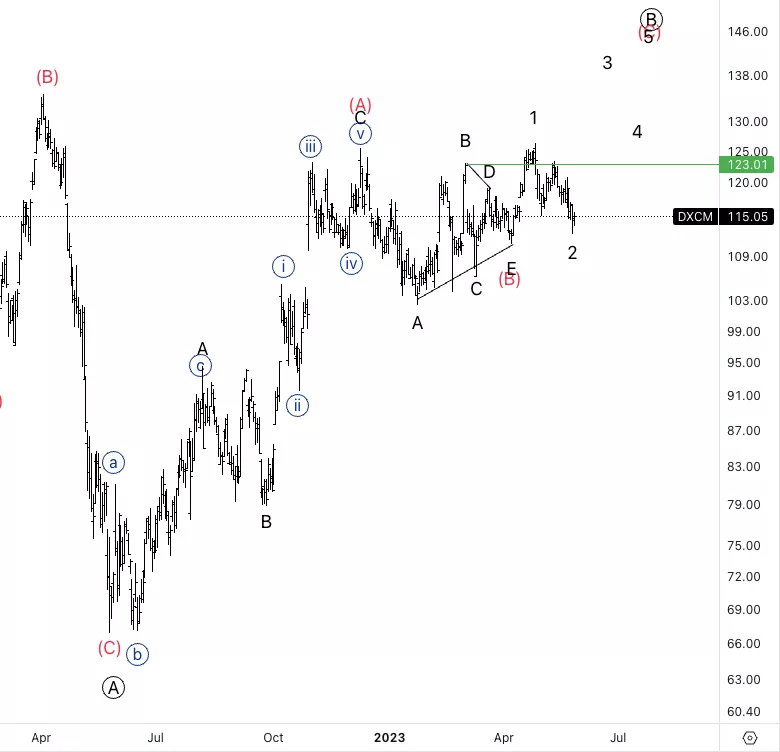
DexCom Inc., (Nasdaq: DXCM): Daily Chart, 30 May 2023.
DXCM Stock Market Analysis: Looking for further upside into wave (C) as we seem to have confirmed the triangle in (B) and we are retracing to find support.
DXCM Elliott Wave Count: Wave 2 of (C).
DXCM Technical Indicators: Above 200EMA.
DXCM Trading Strategy: Looking for longs without breaking wave E, otherwise the whole count is compromised and we could be facing more downside.
Analyst: Alessio Barretta
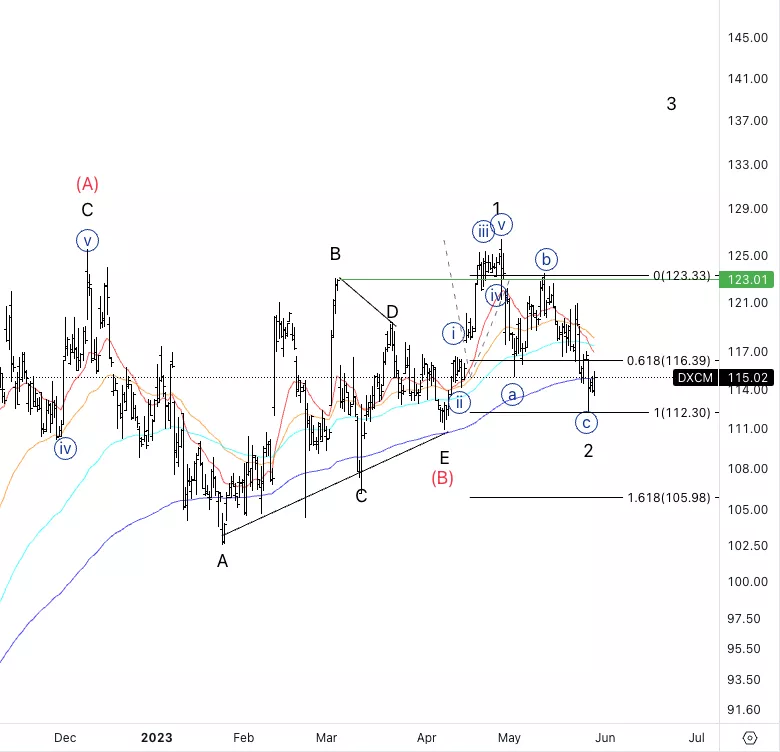
DexCom Inc., DXCM: 4-hour Chart, 30 May 2023.
DexCom Inc., Elliott Wave Technical Analysis
DXCM Stock Market Analysis: It looks like we could have had an ending diagonal into wave {c} to then look for further upside as we also have reacted off equality of {c} vs. {a}.
DXCM Elliott Wave count: Wave {c} of 2.
DXCM Technical Indicators: 200EMA as support.
DXCM Trading Strategy: Looking for upside into {i}.
More By This Author:
Elliott Wave Technical Analysis: Dogecoin/U.S. Dollar - Tuesday, May 30
Stocks Bullish Trend - Elliott Wave Technical Analysis
XRPUSD Elliott Wave Technical Analysis For May 29



Comments
Log in or sign up to join the conversation.